OPEN-SOURCE SCRIPT
VolCorrBeta [NariCapitalTrading]
Indicator Overview: VolCorrBeta [NariCapitalTrading]
The VolCorrBeta [NariCapitalTrading] indicator is designed to analyze and interpret intermarket relationships. This indicator combines volatility, correlation, and beta calculations to provide a comprehensive view of how certain assets (BTC, DXY, CL) influence the ES futures contract (I tailored this indicator to the ES contract, but it will work for any symbol).
Functionality
[u]Input Symbols[/u]
These symbols can be customized according to user preferences. The main focus of the indicator is to analyze how the price movements of these assets correlate with and lead the price movements of the ES futures contract.
[u]Parameters for Calculation[/u]
[u]Key Calculations[/u]
Signal Generation
The indicator generates buy and sell signals based on the filtered lead-lag indicator and confirms them using higher timeframe analysis. Signals are debounced to reduce frequency, ensuring that only significant signals are considered.
Visualization
Customization
Traders can customize the following parameters to tailor the indicator to their specific needs:
The VolCorrBeta [NariCapitalTrading] indicator is designed to analyze and interpret intermarket relationships. This indicator combines volatility, correlation, and beta calculations to provide a comprehensive view of how certain assets (BTC, DXY, CL) influence the ES futures contract (I tailored this indicator to the ES contract, but it will work for any symbol).
Functionality
[u]Input Symbols[/u]
- BTCUSD: Bitcoin to USD
- DXY: US Dollar Index
- CL1!: Crude Oil Futures
- ES1!: S&P 500 Futures
These symbols can be customized according to user preferences. The main focus of the indicator is to analyze how the price movements of these assets correlate with and lead the price movements of the ES futures contract.
[u]Parameters for Calculation[/u]
- Correlation Length: Number of periods for calculating the correlation.
- Standard Deviation Length: Number of periods for calculating the standard deviation.
- Lookback Period for Beta: Number of periods for calculating beta.
- Volatility Filter Length: Length of the volatility filter.
- Volatility Threshold: Threshold for adjusting the lookback period based on volatility.
[u]Key Calculations[/u]
- Returns Calculation: Computes the daily returns for each input symbol.
- Correlation Calculation: Computes the correlation between each input symbol's returns and the ES futures contract returns over the specified correlation length.
- Standard Deviation Calculation: Computes the standard deviation for each input symbol's returns and the ES futures contract returns.
- Beta Calculation: Computes the beta for each input symbol relative to the ES futures contract.
- Weighted Returns Calculation: Computes the weighted returns based on the calculated betas.
- Lead-Lag Indicator: Calculates a lead-lag indicator by averaging the weighted returns.
- Volatility Filter: Smooths the lead-lag indicator using a simple moving average.
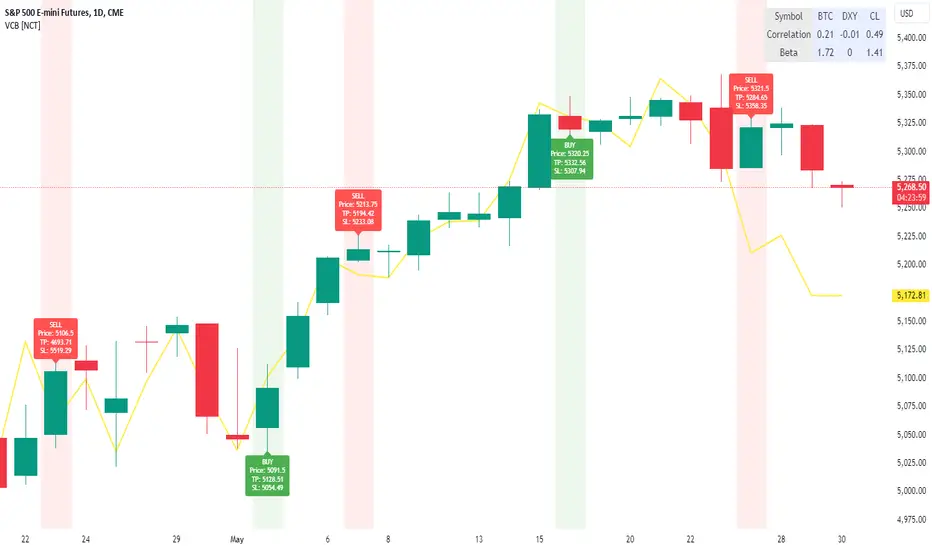
- Price Target Estimation: Estimates the ES price target based on the lead-lag indicator (the yellow line on the chart).
- Dynamic Stop Loss (SL) and Take Profit (TP) Levels: Calculates dynamic SL and TP levels using volatility bands.
Signal Generation
The indicator generates buy and sell signals based on the filtered lead-lag indicator and confirms them using higher timeframe analysis. Signals are debounced to reduce frequency, ensuring that only significant signals are considered.
Visualization
- Background Coloring: The background color changes based on the buy and sell signals for easy visualization (user can toggle this on/off).
- Signal Labels: Labels with arrows are plotted on the chart, showing the signal type (buy/sell), the entry price, TP, and SL levels.
- Estimated ES Price Target: The estimated price target for ES futures is plotted on the chart.
- Correlation and Beta Dashboard: A table displayed in the top right corner shows the current correlation and beta values for [BTC, DXY, and CL] relative to the ES futures contract.
Customization
Traders can customize the following parameters to tailor the indicator to their specific needs:
- Input Symbols: Change the symbols for BTC, DXY, CL, and ES.
- Correlation Length: Adjust the number of periods used for calculating correlation.
- Standard Deviation Length: Adjust the number of periods used for calculating standard deviation.
- Lookback Period for Beta: Change the lookback period for calculating beta.
- Volatility Filter Length: Modify the length of the volatility filter.
- Volatility Threshold: Set a threshold for adjusting the lookback period based on volatility.
- Plotting Options: Customize the colors and line widths of the plotted elements.
开源脚本
秉承TradingView的精神,该脚本的作者将其开源,以便交易者可以查看和验证其功能。向作者致敬!您可以免费使用该脚本,但请记住,重新发布代码须遵守我们的网站规则。
免责声明
这些信息和出版物并非旨在提供,也不构成TradingView提供或认可的任何形式的财务、投资、交易或其他类型的建议或推荐。请阅读使用条款了解更多信息。
开源脚本
秉承TradingView的精神,该脚本的作者将其开源,以便交易者可以查看和验证其功能。向作者致敬!您可以免费使用该脚本,但请记住,重新发布代码须遵守我们的网站规则。
免责声明
这些信息和出版物并非旨在提供,也不构成TradingView提供或认可的任何形式的财务、投资、交易或其他类型的建议或推荐。请阅读使用条款了解更多信息。