INVITE-ONLY SCRIPT
已更新 Smoothed Candles
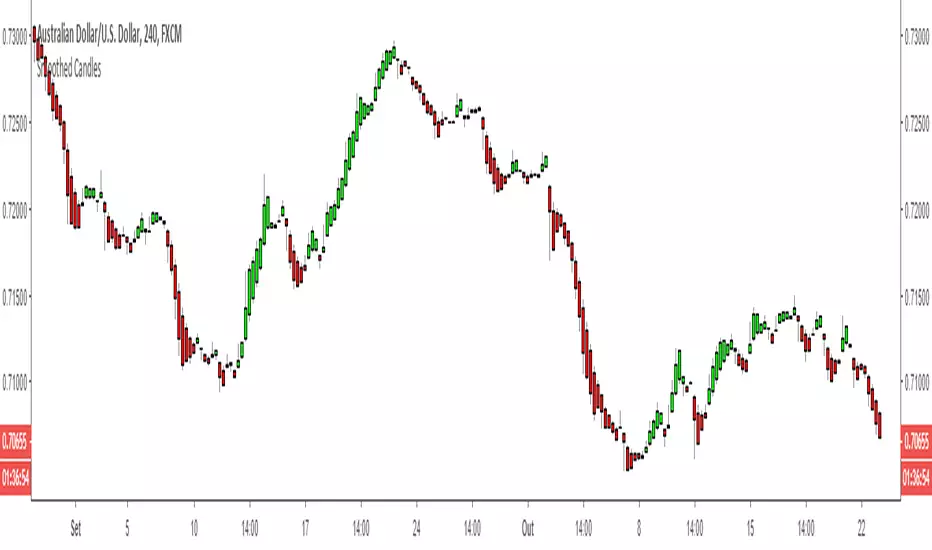
It is a graphical indicator used to identify trends and pullbacks. Through it, it is possible to eliminate the noises and clearly see the smoothed pattern.
How should I use it ? This is just a example to be used with this indicator.
Let's assume that we are looking for sell opportunities.

 AUDUSD
The example can be better described in the image below:

 EURUSD
Another example os use, displayed in the image below:

 EURJPY
Look how makes it easy to identify tops and bottoms.

 BTCUSD
Very easy to indetify trends:

 GBPUSD
Very easy to indetify pullbacks:

AUDGBP

It can be used with almost of pairs!
You can buy the script here:
http://502a96d9.ngrok.io
How should I use it ? This is just a example to be used with this indicator.
Let's assume that we are looking for sell opportunities.
- step 1: identify some (at least 3) positives (green) candles with a good volume, excluding consolidation regions.
- step 2: wait for negative (red) candles with a good volume and also all previous candles must be by majority green.
- step 3: wait for pullback with high volume or consolidation region to close the position.
The example can be better described in the image below:
Another example os use, displayed in the image below:
Look how makes it easy to identify tops and bottoms.
Very easy to indetify trends:
Very easy to indetify pullbacks:
It can be used with almost of pairs!
You can buy the script here:
http://502a96d9.ngrok.io
版本注释
It is a graphical indicator used to identify trends and pullbacks. Through it, it is possible to eliminate the noises and clearly see the smoothed pattern. How should I use it ? This is just a example to be used with this indicator.
Let's assume that we are looking for sell opportunities.
step 1: identify some (at least 3) positives (green) candles with a good volume , excluding consolidation regions.
step 2: wait for negative (red) candles with a good volume and also all previous candles must be by majority green.
step 3: wait for pullback with high volume or consolidation region to close the position.
The example can be better described in the image below:
Another example os use, displayed in the image below:
Look how makes it easy to identify tops and bottoms.
Very easy to indetify trends:
Very easy to indetify pullbacks:
It can be used with almost of pairs!
You can buy the script here:
https://perfect-cat-87.localtunnel.me
版本注释
It is a graphical indicator used to identify trends and pullbacks. Through it, it is possible to eliminate the noises and clearly see the smoothed pattern. How should I use it ? This is just a example to be used with this indicator.
Let's assume that we are looking for sell opportunities.
step 1: identify some (at least 3) positives (green) candles with a good volume , excluding consolidation regions.
step 2: wait for negative (red) candles with a good volume and also all previous candles must be by majority green.
step 3: wait for pullback with high volume or consolidation region to close the position.
The example can be better described in the image below:
Another example os use, displayed in the image below:
Look how makes it easy to identify tops and bottoms.
Very easy to indetify trends:
Very easy to indetify pullbacks:
It can be used with almost of pairs!
You can check the script here:
https://perfect-cat-87.localtunnel.me
仅限邀请脚本
只有作者授权的用户才能访问此脚本。您需要申请并获得使用许可。通常情况下,付款后即可获得许可。更多详情,请按照下方作者的说明操作,或直接联系FranciscoBiaso。
TradingView不建议您付费购买或使用任何脚本,除非您完全信任其作者并了解其工作原理。您也可以在我们的社区脚本找到免费的开源替代方案。
作者的说明
免责声明
这些信息和出版物并非旨在提供,也不构成TradingView提供或认可的任何形式的财务、投资、交易或其他类型的建议或推荐。请阅读使用条款了解更多信息。
仅限邀请脚本
只有作者授权的用户才能访问此脚本。您需要申请并获得使用许可。通常情况下,付款后即可获得许可。更多详情,请按照下方作者的说明操作,或直接联系FranciscoBiaso。
TradingView不建议您付费购买或使用任何脚本,除非您完全信任其作者并了解其工作原理。您也可以在我们的社区脚本找到免费的开源替代方案。
作者的说明
免责声明
这些信息和出版物并非旨在提供,也不构成TradingView提供或认可的任何形式的财务、投资、交易或其他类型的建议或推荐。请阅读使用条款了解更多信息。