OPEN-SOURCE SCRIPT
已更新 Moving Average and Pearson Levels
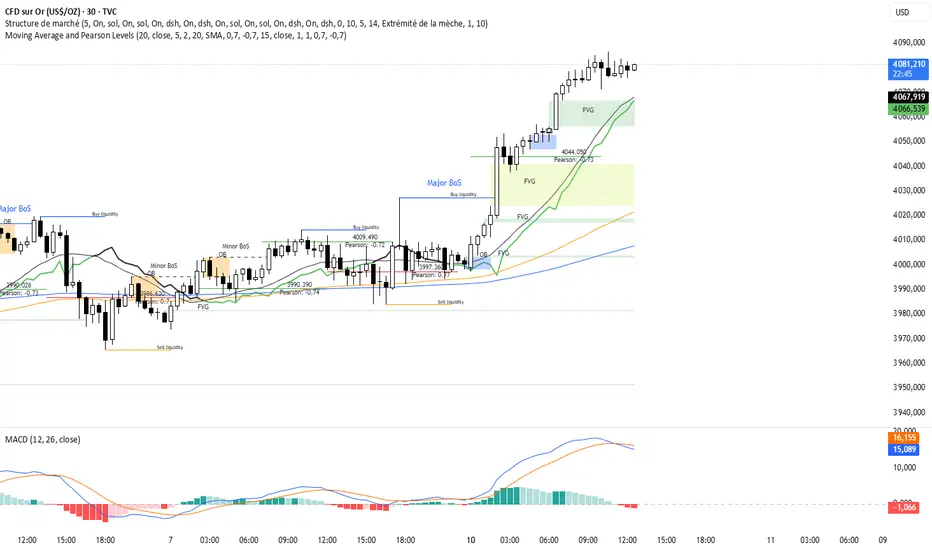
Moving Average and Pearson Levels Indicator
This Pine Script indicator combines a customizable moving average (MA) with Pearson correlation analysis to provide traders with deeper insights into trends and key reference levels. It overlays a Pearson-adjusted moving average on price charts and highlights levels based on correlation for potential trading opportunities. With flexible parameters, it adapts to various trading styles.
Key Features
Pearson-Adjusted Moving Average
Combines a basic MA (SMA, EMA, WMA, or VWMA) with a Pearson correlation adjustment to reflect trend strength.
Adjustable: MA length, price source, smoothing, and line thickness.
Optional color changes based on trends (positive/negative).
Pearson Correlation Levels
Plots smoothed Pearson correlation with upper/lower thresholds to signal strong or weak trends.
Marks entry levels with price labels and dynamic colors when thresholds are crossed.
Customizable: Pearson length, smoothing, thresholds, and colors.
Reference Levels and Alerts
Optional dotted lines for upper, lower, and zero correlation thresholds.
Alerts for bullish MA signals (crossing the lower threshold) and bearish signals (crossing below the upper threshold).
How It Works
Moving Average: Calculates a standard moving average enhanced by a Pearson adjustment based on price trends over a given period.
Pearson Levels: Computes the strength of correlation, smoothed for better readability, and plots price lines at threshold crossings.
Visualization: Displays the MA and levels with trend-reactive colors and optional reference lines.
Usage
Ideal for traders who combine traditional MAs with statistical trend analysis.
Adjust the MA type and Pearson length for short-term or long-term strategies.
Use correlation levels for reversal signals or trend confirmation.
Customization Options
MA Parameters: Select the type, length, and smoothing of the MA; toggle visibility and color changes.
Pearson Levels: Adjust thresholds, line thickness, and label colors.
Display Options: Show/hide reference lines and the standard MA for comparison purposes.
Example Settings
MA Length: 20
Type: EMA
Pearson Length: 15
Thresholds: 0.7/-0.7
Colors: Positive (black), Negative (green), Levels (gray)
Notes
Optimize based on your preferred timeframe.
Adjust smoothing to balance responsiveness and clarity.
Try it out, customize it to your needs, and enhance your trading setup! Feedback and suggestions are welcome.
版本注释
Modification pour blocage开源脚本
秉承TradingView的精神,该脚本的作者将其开源,以便交易者可以查看和验证其功能。向作者致敬!您可以免费使用该脚本,但请记住,重新发布代码须遵守我们的网站规则。
免责声明
这些信息和出版物并非旨在提供,也不构成TradingView提供或认可的任何形式的财务、投资、交易或其他类型的建议或推荐。请阅读使用条款了解更多信息。
免责声明
这些信息和出版物并非旨在提供,也不构成TradingView提供或认可的任何形式的财务、投资、交易或其他类型的建议或推荐。请阅读使用条款了解更多信息。