PROTECTED SOURCE SCRIPT
Universally Applicable Valuation Indicator
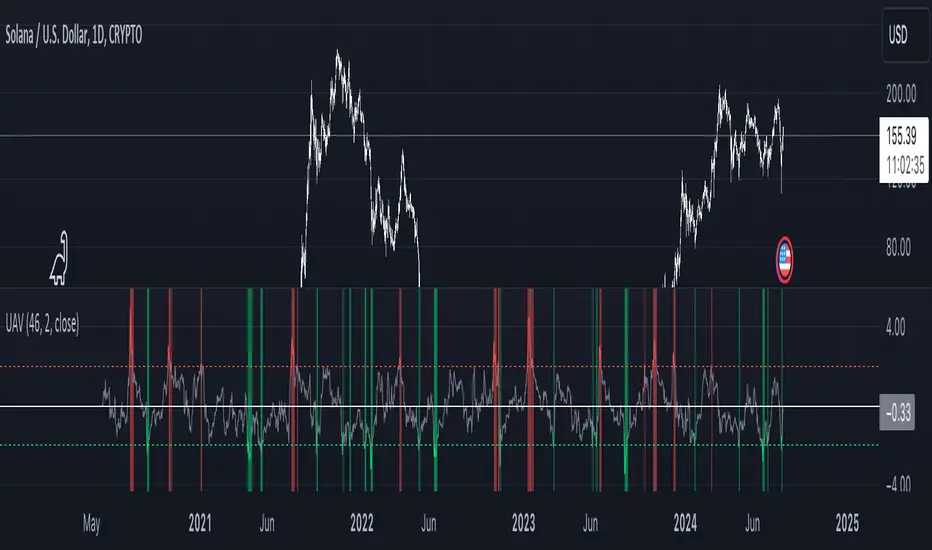
The UAV indicator utilizes a z-score analysis of the Relative Strength Index (RSI) to offer insights into current market conditions.
By comparing the current z-score to its historical distribution, the indicator generates signals that highlight potential overbought or oversold areas.
It features clear visual cues, with color changes occurring as the score crosses plotted standard deviation lines, making it easier to identify potential entry and exit points across all assets and timeframes.
受保护脚本
此脚本以闭源形式发布。 但是,您可以自由使用,没有任何限制 — 了解更多信息这里。
免责声明
这些信息和出版物并非旨在提供,也不构成TradingView提供或认可的任何形式的财务、投资、交易或其他类型的建议或推荐。请阅读使用条款了解更多信息。
免责声明
这些信息和出版物并非旨在提供,也不构成TradingView提供或认可的任何形式的财务、投资、交易或其他类型的建议或推荐。请阅读使用条款了解更多信息。