OPEN-SOURCE SCRIPT
Awesome Oscillator Twin Peaks Strategy
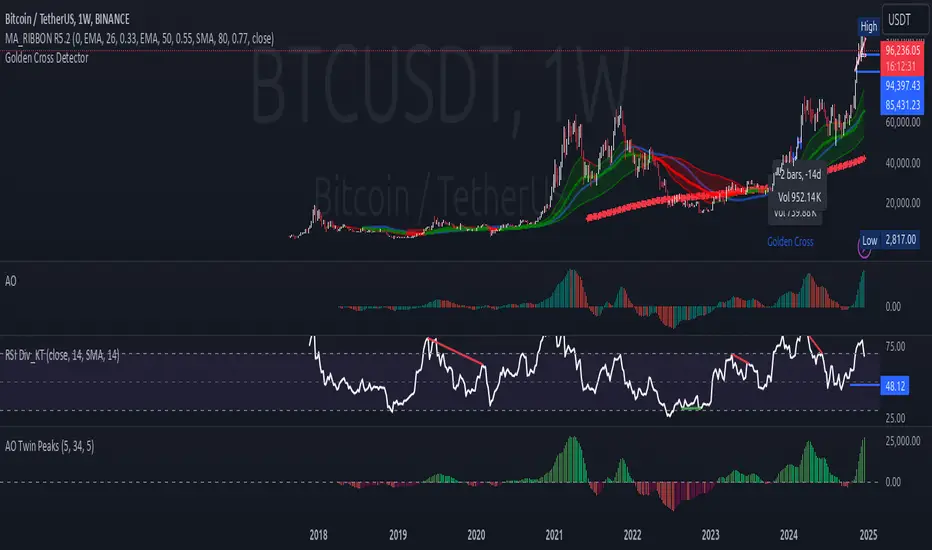
1. The indicator identifies both bullish and bearish twin peaks:
- Bullish: Two consecutive valleys below zero, where the second valley is higher than the first
- Bearish: Two consecutive peaks above zero, where the second peak is lower than the first
2. Visual elements:
- AO histogram with color-coding for increasing/decreasing values
- Triangle markers for confirmed twin peak signals
- Zero line for reference
- Customizable colors through inputs
3. Built-in safeguards:
- Minimum separation between peaks to avoid false signals
- Maximum time window for pattern completion
- Clear signal reset conditions
4. Alert conditions for both bullish and bearish signals
To use this indicator:
1. Add it to your TradingView chart
2. Customize the input parameters if needed
3. Look for triangle markers that indicate confirmed twin peak patterns
4. Optional: Set up alerts based on the signal conditions
开源脚本
秉承TradingView的精神,该脚本的作者将其开源,以便交易者可以查看和验证其功能。向作者致敬!您可以免费使用该脚本,但请记住,重新发布代码须遵守我们的网站规则。
免责声明
这些信息和出版物并非旨在提供,也不构成TradingView提供或认可的任何形式的财务、投资、交易或其他类型的建议或推荐。请阅读使用条款了解更多信息。
免责声明
这些信息和出版物并非旨在提供,也不构成TradingView提供或认可的任何形式的财务、投资、交易或其他类型的建议或推荐。请阅读使用条款了解更多信息。