OPEN-SOURCE SCRIPT
Historical & Periodic Key Levels

Historical & Periodic Key Levels
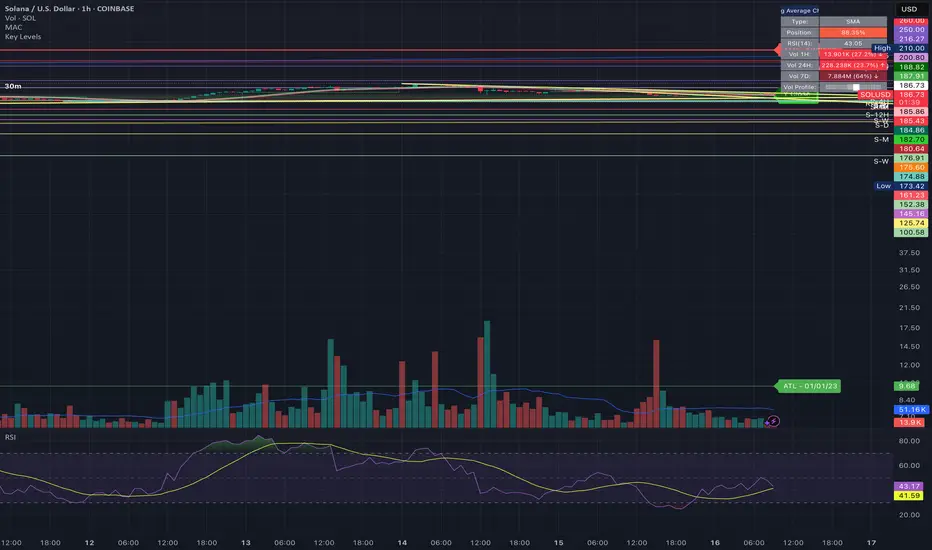
This indicator automatically plots historical key levels (ATH/ATL) and periodic closing levels (Daily, Weekly, Monthly, Yearly). It highlights major price zones frequently used in technical and institutional trading.
Key Features:
Usage:
Inputs:
Notes:
This indicator automatically plots historical key levels (ATH/ATL) and periodic closing levels (Daily, Weekly, Monthly, Yearly). It highlights major price zones frequently used in technical and institutional trading.
Key Features:
- Dynamic ATH/ATL: tracks all-time high/low with date annotation.
- Periodic Closes: previous D/W/M/Y closes with directional coloring.
- Adaptive Colors: green/red based on bullish or bearish close.
- Full Customization: toggle visibility, colors, line width, text alignment, and label text.
- Smart Label Management: prevents overlap by cycling through label styles automatically.
Usage:
- Identify strong support/resistance levels.
- Monitor key closing prices across multiple timeframes.
- Enhance swing trading and long-term analysis with institutional reference levels.
Inputs:
- Levels Visibility: show/hide ATH, ATL, and periodic closes.
- ATH/ATL Style Settings: line colors, label prefix, width, and text alignment.
- Periodic Levels Style: label text (D/W/M/Y), line width, alignment, and bullish/bearish colors.
Notes:
- Levels adjust automatically to the active chart timeframe.
- Lower timeframe levels are hidden when redundant (e.g., daily close on daily chart).
开源脚本
秉承TradingView的精神,该脚本的作者将其开源,以便交易者可以查看和验证其功能。向作者致敬!您可以免费使用该脚本,但请记住,重新发布代码须遵守我们的网站规则。
免责声明
这些信息和出版物并非旨在提供,也不构成TradingView提供或认可的任何形式的财务、投资、交易或其他类型的建议或推荐。请阅读使用条款了解更多信息。
开源脚本
秉承TradingView的精神,该脚本的作者将其开源,以便交易者可以查看和验证其功能。向作者致敬!您可以免费使用该脚本,但请记住,重新发布代码须遵守我们的网站规则。
免责声明
这些信息和出版物并非旨在提供,也不构成TradingView提供或认可的任何形式的财务、投资、交易或其他类型的建议或推荐。请阅读使用条款了解更多信息。