PROTECTED SOURCE SCRIPT
Awesome Oscillator (AO) - Two EMA / SMA
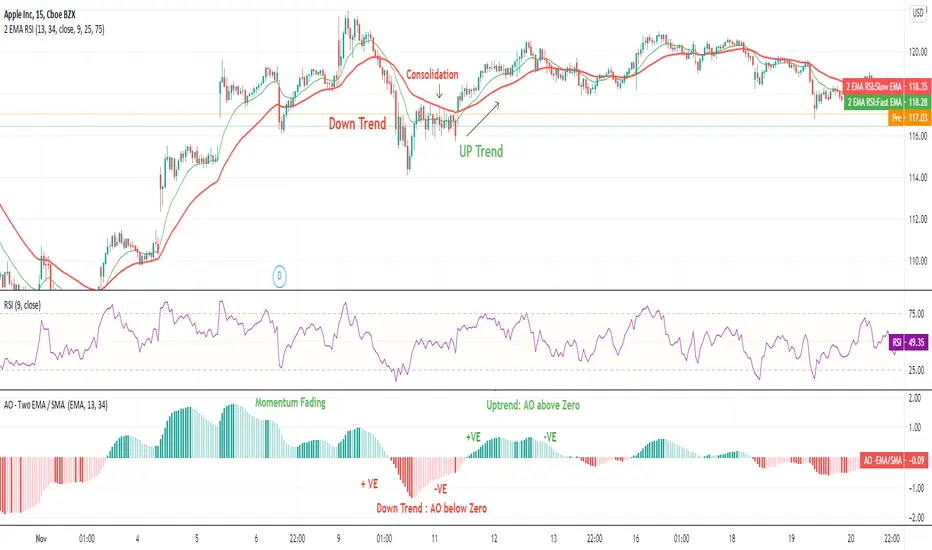
Awesome Oscillator with EMA indicator plots Awesome Oscillator indicator (Bill M. Williams) on Two Exponential Moving Averages.
The value of the Awesome Oscillator indicator is calculated as the difference between moving averages over these two time frames.
Rather than using closing prices, though, these moving averages use the midpoints of the bars (i.e. halfway between the high and the low).
Midpoint = (H + L)/2
AO = Fast Moving Average - Slow Moving Average
The indicator subtracts the Fast Moving Average from the Slow Moving Average and plots this value as a histogram.
It measures the market momentum with the aim to detect potential trend direction or trend reversals and momentum.
How to read the Indicator ?
- When AO is greater than zero line, it is an uptrend. When AO is less than zero it is a downtrend.Rising AO indicates momentum intact. Falling AO indicates momentum loosing the steam.When AO is nearing zero, one can expect the trend reversal & big move in opposite direction in trending market.
受保护脚本
此脚本以闭源形式发布。 但是,您可以自由使用,没有任何限制 — 了解更多信息这里。
免责声明
这些信息和出版物并非旨在提供,也不构成TradingView提供或认可的任何形式的财务、投资、交易或其他类型的建议或推荐。请阅读使用条款了解更多信息。
受保护脚本
此脚本以闭源形式发布。 但是,您可以自由使用,没有任何限制 — 了解更多信息这里。
免责声明
这些信息和出版物并非旨在提供,也不构成TradingView提供或认可的任何形式的财务、投资、交易或其他类型的建议或推荐。请阅读使用条款了解更多信息。