OPEN-SOURCE SCRIPT
VWAP Trend
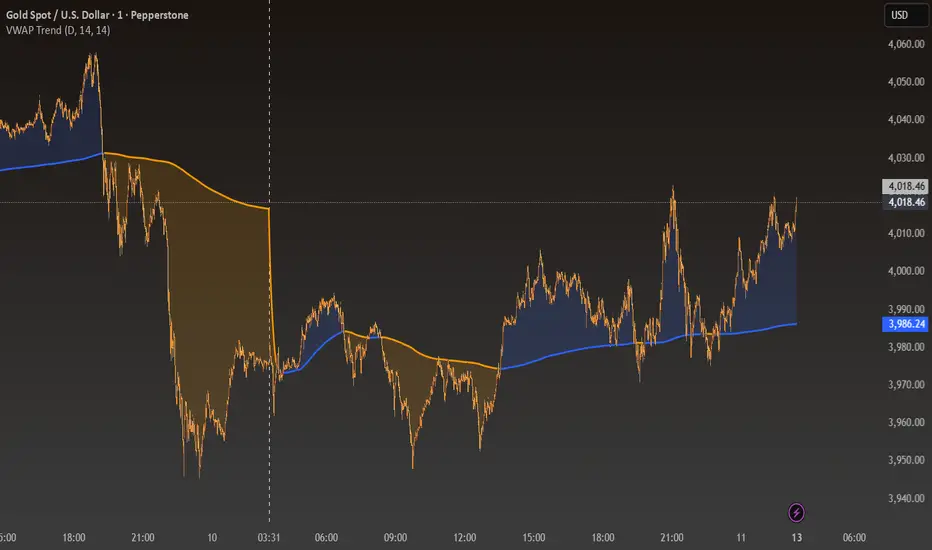
The VWAP Trend indicator is a powerful visualization tool that blends a smoothed Volume-Weighted Average Price (VWAP) with a trend-following EMA to reveal the underlying market bias in a clear, color-coded format.
Unlike a standard VWAP that only resets intraday, VWAP Trend allows traders to anchor VWAP calculations to Daily, Weekly, or Monthly sessions. This flexibility makes it suitable for all trading styles — from intraday scalping to long-term swing analysis.
The smoothed VWAP provides a stable representation of the true average price weighted by volume, while the EMA reflects the prevailing market trend. When the EMA remains above the VWAP, the indicator highlights bullish conditions with blue tones. When it moves below, bearish momentum is displayed with orange tones.
Features
Adjustable VWAP anchor timeframe (Daily, Weekly, or Monthly)
Smoothed VWAP for reduced noise and improved accuracy
Dynamic EMA overlay for real-time trend detection
Color-coded shading between price and VWAP
Minimalist design ideal for clean chart analysis
How to Use
Select your preferred VWAP anchor timeframe.
Observe how the shading color shifts between blue (bullish) and orange (bearish).
Use these transitions to gauge market bias, confirm trade setups, or identify potential mean reversion zones.
开源脚本
本着TradingView的真正精神,此脚本的创建者将其开源,以便交易者可以查看和验证其功能。向作者致敬!虽然您可以免费使用它,但请记住,重新发布代码必须遵守我们的网站规则。
免责声明
这些信息和出版物并不意味着也不构成TradingView提供或认可的金融、投资、交易或其它类型的建议或背书。请在使用条款阅读更多信息。
开源脚本
本着TradingView的真正精神,此脚本的创建者将其开源,以便交易者可以查看和验证其功能。向作者致敬!虽然您可以免费使用它,但请记住,重新发布代码必须遵守我们的网站规则。
免责声明
这些信息和出版物并不意味着也不构成TradingView提供或认可的金融、投资、交易或其它类型的建议或背书。请在使用条款阅读更多信息。