OPEN-SOURCE SCRIPT
Pearsons R historic breaks ( for making strategy out of it )
Pearsons R adjustments of linear regressions is a good tool to analyse visually the trend basis channeling of the market,
one of the common challenges in the scripts which i came across the tradingview community is the lack of the historic places put over the charts where the price actually crossed up/below the channel boundaries,
For me in order to do so we would have to replay the scripts over and over.
So I came up with an addon extension to a good script on the community (tradingview.com/script/FZXagyA6-Linear-Regression-Auto-Adjust-To-Ideal-Pearson-s-R-Min-Max/)
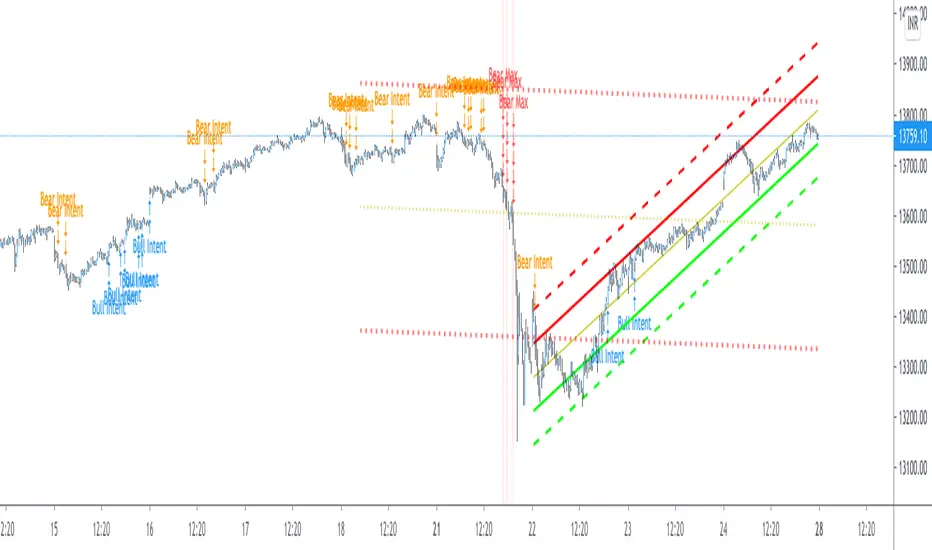
I have added the historic marks over the charts ( blue/green/red/orange Arrows which you see on the charts)
These arrows are the places where the price have crossed the channel boundaries historically
So,
Blue arrow = Bull Intent ,Place where the upper channel boundary line have been crossed
Orange arrow = Bear Intent , Place where the Lower channel boundary line have been crossed
Green arrow = Bull Max , Place where the Maximum Upper channel boundary line have been crossed
Red arrow = Bear Max , Place where the Minimum Lower channel boundary line have been crossed
For me this type of approach is good for making a strategy out of the concepts visually, in congestion to other indicators
I would suggest you guys to check this on alert basis with your setups to derive out the best from linear regressions
Lastly it would be a pleasure to give credits to the creators of Pearsons R scripts in Tradingview
@midtownsk8rguy
TradeBoneDogs
@x11joe [this code base is inspired from tradingview.com/script/FZXagyA6-Linear-Regression-Auto-Adjust-To-Ideal-Pearson-s-R-Min-Max/]
Also thanking Tradingview for providing us such an awesome community and platform :)
one of the common challenges in the scripts which i came across the tradingview community is the lack of the historic places put over the charts where the price actually crossed up/below the channel boundaries,
For me in order to do so we would have to replay the scripts over and over.
So I came up with an addon extension to a good script on the community (tradingview.com/script/FZXagyA6-Linear-Regression-Auto-Adjust-To-Ideal-Pearson-s-R-Min-Max/)
I have added the historic marks over the charts ( blue/green/red/orange Arrows which you see on the charts)
These arrows are the places where the price have crossed the channel boundaries historically
So,
Blue arrow = Bull Intent ,Place where the upper channel boundary line have been crossed
Orange arrow = Bear Intent , Place where the Lower channel boundary line have been crossed
Green arrow = Bull Max , Place where the Maximum Upper channel boundary line have been crossed
Red arrow = Bear Max , Place where the Minimum Lower channel boundary line have been crossed
For me this type of approach is good for making a strategy out of the concepts visually, in congestion to other indicators
I would suggest you guys to check this on alert basis with your setups to derive out the best from linear regressions
Lastly it would be a pleasure to give credits to the creators of Pearsons R scripts in Tradingview
@midtownsk8rguy
TradeBoneDogs
@x11joe [this code base is inspired from tradingview.com/script/FZXagyA6-Linear-Regression-Auto-Adjust-To-Ideal-Pearson-s-R-Min-Max/]
Also thanking Tradingview for providing us such an awesome community and platform :)
开源脚本
秉承TradingView的精神,该脚本的作者将其开源,以便交易者可以查看和验证其功能。向作者致敬!您可以免费使用该脚本,但请记住,重新发布代码须遵守我们的网站规则。
Get Ocs Ai Trader, Your personal Ai Trade Assistant here
→ ocstrader.com
About me
AlgoTrading Certification, ( University of Oxford, Säid Business School )
PGP Research Analysis, ( NISM, SEBI )
Electronics Engineer
→ ocstrader.com
About me
AlgoTrading Certification, ( University of Oxford, Säid Business School )
PGP Research Analysis, ( NISM, SEBI )
Electronics Engineer
免责声明
这些信息和出版物并非旨在提供,也不构成TradingView提供或认可的任何形式的财务、投资、交易或其他类型的建议或推荐。请阅读使用条款了解更多信息。