OPEN-SOURCE SCRIPT
Closest Candle to EMA (CCE)
🔍 Closest Candle to EMA (CCE)
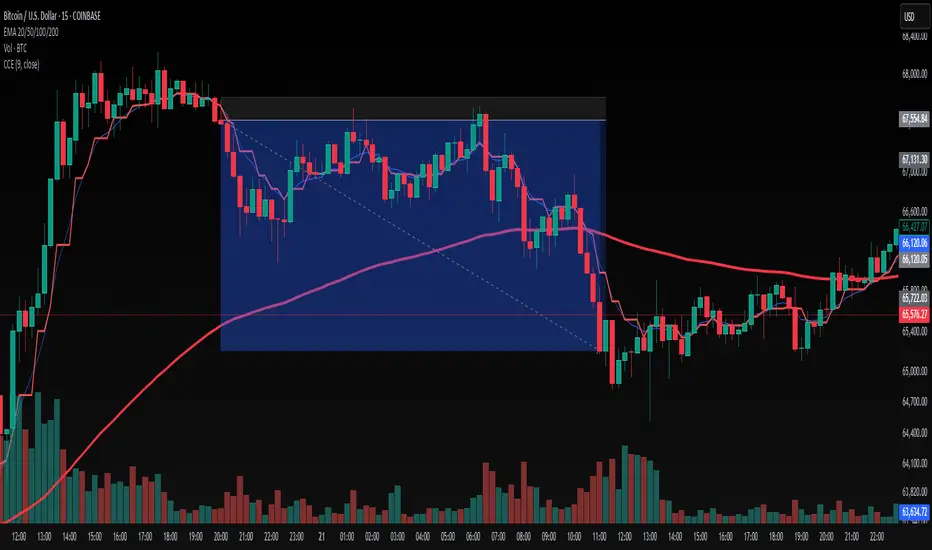
The Closest Candle to EMA (CCE) indicator is a visual analytical tool designed to identify the historical price (candle close) that is closest to the current Exponential Moving Average (EMA) over a user-defined period. This allows traders to easily detect how price has interacted with the trend line recently, providing insights into potential mean reversion, support/resistance, and price convergence behavior.
📌 Key Features
✅ Highlights the candle with a closing price closest to the current EMA
✅ Customizable EMA length for various trading styles and timeframes
✅ Helps detect potential zones of trend interaction
✅ Supports analysis of price behavior near dynamic support/resistance
✅ Lightweight and non-intrusive visual overlay (red = closest price, blue = EMA)
🧠 How It Works
The script calculates the EMA using the user-defined length (default: 20).
It then scans the last N candles (equal to the EMA length) and finds the one whose closing price is closest to the current EMA value.
That close is highlighted in red, while the EMA is shown in blue.
This comparison helps traders understand the proximity of past price action to the current trend level.
💡 Use Cases
Mean Reversion Strategies – Spot when price historically reverts to the trend
Dynamic Support/Resistance Identification – Find levels where price respected or returned to the EMA
Consolidation Zone Analysis – Identify areas where price hovered around trend lines
Backtesting Trend Sensitivity – See how price reacted to EMA over time
⚙️ Settings
EMA Length – Set the number of periods used for EMA and comparison window (default: 20)
📊 Example Strategy Setup – EMA Touch with Reversal Candle
This indicator can be incorporated into a price-action strategy that combines candlestick patterns, EMA proximity, and volume confirmation. Here's a practical use case:
🔧 Note: This setup is designed specifically with the EMA length set to 9.
🔁 Bullish Setup – Hammer + EMA (in uptrend)
The market is in an uptrend, confirmed by EMA(9) sloping upward
A Hammer candlestick forms
The EMA (blue) must touch the lower shadow (wick) of the Hammer
It must not touch the candle body
Candle volume is above average
→ ✅ This may signal a bullish continuation opportunity
🔁 Bearish Setup – Shooting Star + EMA (in downtrend)
The market is in a downtrend, confirmed by EMA(9) sloping downward
A Shooting Star candlestick forms
The EMA (blue) must touch the upper shadow (wick) of the candle
It must not touch the candle body
Candle volume is above average
开源脚本
秉承TradingView的精神,该脚本的作者将其开源,以便交易者可以查看和验证其功能。向作者致敬!您可以免费使用该脚本,但请记住,重新发布代码须遵守我们的网站规则。
免责声明
这些信息和出版物并非旨在提供,也不构成TradingView提供或认可的任何形式的财务、投资、交易或其他类型的建议或推荐。请阅读使用条款了解更多信息。
免责声明
这些信息和出版物并非旨在提供,也不构成TradingView提供或认可的任何形式的财务、投资、交易或其他类型的建议或推荐。请阅读使用条款了解更多信息。