PROTECTED SOURCE SCRIPT
Multi-Time Period Charts YSTC
The script is available (for free) to YSTC's Course members of "Trading with PAV".
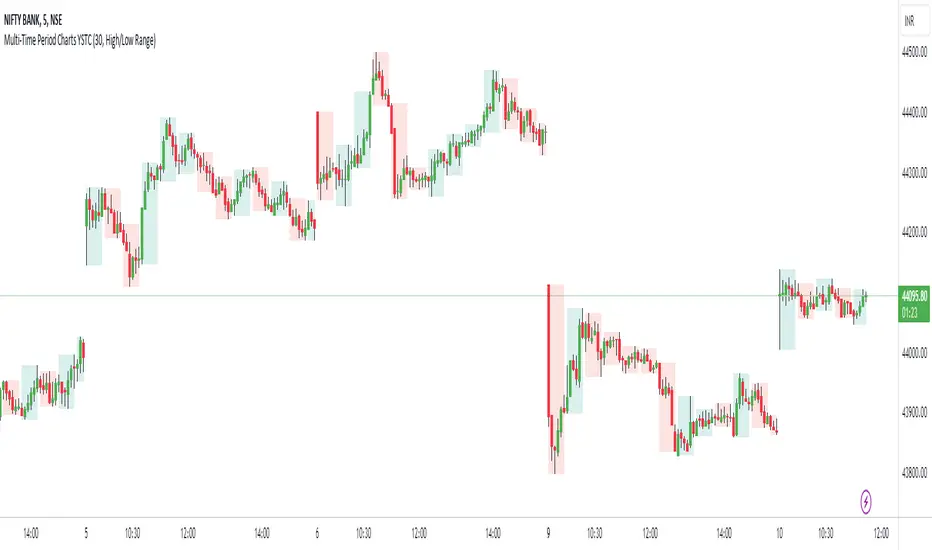
Multi-Time Period Charts lets you see more time frames on one chart.
Open 5 min Chart and turn off AutoTimeFrame and apply 15 min in indicator settings.

As you can see in the above image you can see 15 min candle on 5 min chart.
Below are some of the settings explained.
AutoTimeFrame
When the Auto option is selected, the timeframe of the indicator is chosen automatically based on the chart timeframe. The Timeframe dropdown is ignored. The automated timeframes are:
Calculation
You can add this script to your chart by clicking "Add to favorite indicators" below.
Have Questions ?
contact@ystc.in
Free Stock Market Introduction Available.
Name: Yogesh Patil (YS Trading Coach).
Contact: +91 9637070868.
Time: Monday to Friday (10:00 AM - 07:00 PM).
Multi-Time Period Charts lets you see more time frames on one chart.
Open 5 min Chart and turn off AutoTimeFrame and apply 15 min in indicator settings.
As you can see in the above image you can see 15 min candle on 5 min chart.
Below are some of the settings explained.
AutoTimeFrame
When the Auto option is selected, the timeframe of the indicator is chosen automatically based on the chart timeframe. The Timeframe dropdown is ignored. The automated timeframes are:
- 1 day for any chart timeframes below 1 day
- 1 week for any timeframes starting from 1 day up to 1 week
- 1 month for any timeframes starting from 1 week up to 1 month
- 3 months for any timeframes starting from 1 month up to 3 months
- 12 months for any timeframes above 3 months
Calculation
- True Range (calculates the close price of the previous period)
- High/Low Range (calculates the high and low for the chosen period)
- Heikin Ashi Range (calculates the Heikin Ashi High and Heikin Ashi Low for the chosen period).
- Can toggle the color and visibility of the up/down candles and their borders (Borders already disabled by turning opacity to 0).
You can add this script to your chart by clicking "Add to favorite indicators" below.
Have Questions ?
contact@ystc.in
Free Stock Market Introduction Available.
Name: Yogesh Patil (YS Trading Coach).
Contact: +91 9637070868.
Time: Monday to Friday (10:00 AM - 07:00 PM).
受保护脚本
此脚本以闭源形式发布。 但是,您可以自由使用,没有任何限制 — 了解更多信息这里。
免责声明
这些信息和出版物并非旨在提供,也不构成TradingView提供或认可的任何形式的财务、投资、交易或其他类型的建议或推荐。请阅读使用条款了解更多信息。
受保护脚本
此脚本以闭源形式发布。 但是,您可以自由使用,没有任何限制 — 了解更多信息这里。
免责声明
这些信息和出版物并非旨在提供,也不构成TradingView提供或认可的任何形式的财务、投资、交易或其他类型的建议或推荐。请阅读使用条款了解更多信息。