OPEN-SOURCE SCRIPT
已更新 Balance of Force Day of the Week (BOFDW)
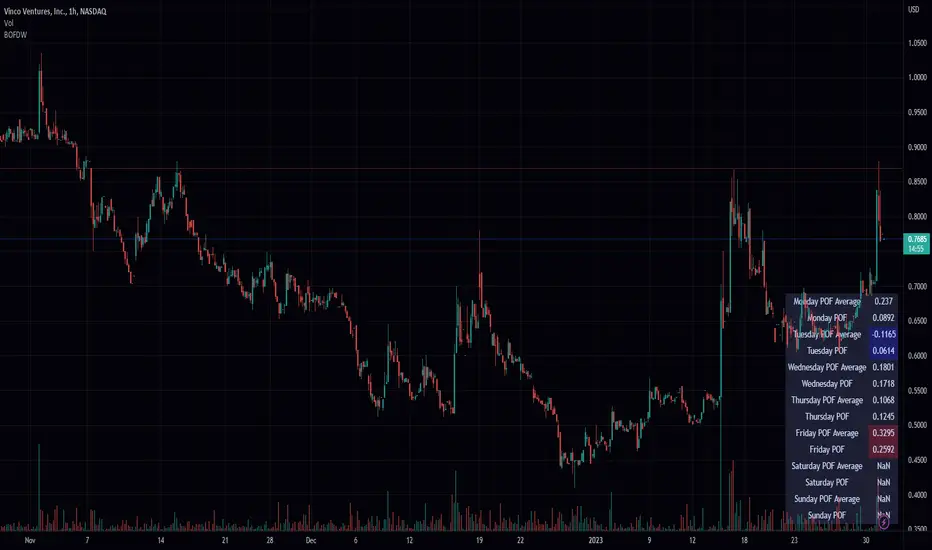
The script is a custom technical indicator for TradingView that is based on an analysis of the price movements of a financial instrument over the course of a week. The indicator uses a variety of inputs, including the open and close prices for each day of the week, to determine the "BOF" (BOF) for each day.
The BOF is calculated based on the relative magnitude of bullish and bearish price movements and is then used to determine the average BOF over a moving window of data points. This average BOF is displayed on the chart as an overlay, providing a measure of the average bullishness or bearishness of the financial instrument over the course of a week.
The indicator also allows users to specify the location of the overlay on the chart and to customize the appearance of the overlay with options for text and box colors. The script provides a number of built-in options for chart position, including the top-left, top-middle, top-right, middle-left, middle-center, middle-right, bottom-left, bottom-middle, and bottom-right corners of the chart.
Overall, this custom technical indicator is a useful tool for traders and investors who are looking to gain a deeper understanding of the price trends of a financial instrument over the course of a week. By providing a clear and concise measure of the average POF over time, the indicator can help users identify key patterns in the market and make more informed trading decisions.
版本注释
lol "My script"开源脚本
秉承TradingView的精神,该脚本的作者将其开源,以便交易者可以查看和验证其功能。向作者致敬!您可以免费使用该脚本,但请记住,重新发布代码须遵守我们的网站规则。
免责声明
这些信息和出版物并非旨在提供,也不构成TradingView提供或认可的任何形式的财务、投资、交易或其他类型的建议或推荐。请阅读使用条款了解更多信息。
开源脚本
秉承TradingView的精神,该脚本的作者将其开源,以便交易者可以查看和验证其功能。向作者致敬!您可以免费使用该脚本,但请记住,重新发布代码须遵守我们的网站规则。
免责声明
这些信息和出版物并非旨在提供,也不构成TradingView提供或认可的任何形式的财务、投资、交易或其他类型的建议或推荐。请阅读使用条款了解更多信息。