PROTECTED SOURCE SCRIPT
Supply In Profit Z-Score | Vistula Labs
Overview
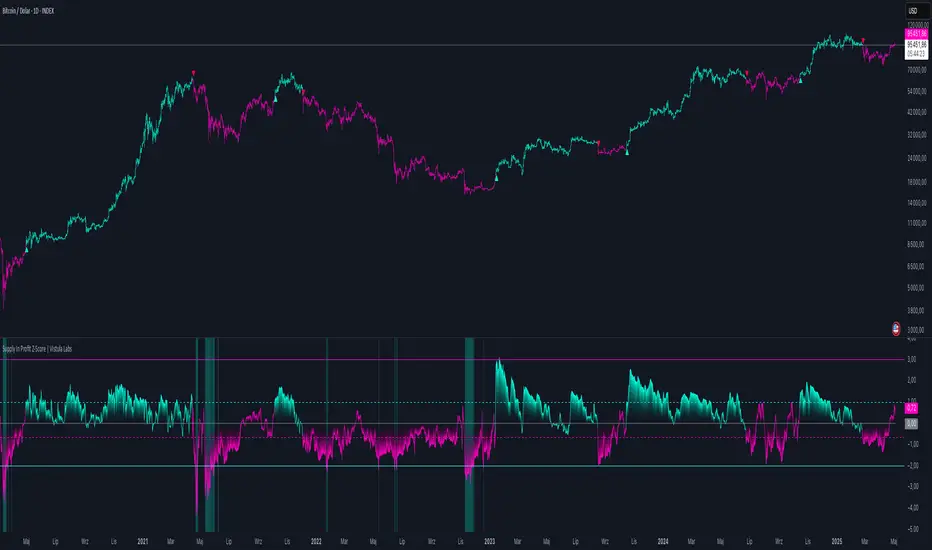
The Supply In Profit Z-Score indicator is a Pine Script™ tool developed by Vistula Labs for technical analysis of cryptocurrencies, specifically Bitcoin (BTC) and Ethereum (ETH). It utilizes on-chain data from IntoTheBlock to calculate the difference between the percentage of addresses in profit and those in loss, transforming this metric into a Z-Score. This indicator helps traders identify market sentiment, trend-following opportunities, and overbought or oversold conditions.
What is Supply In Profit?
Supply In Profit is defined as the net difference between the percentage of addresses in profit and those in loss:
A positive value indicates more addresses are in profit, suggesting bullish sentiment, while a negative value indicates widespread losses, hinting at bearish sentiment.
How It Works
The indicator computes a Z-Score to normalize the Supply In Profit data relative to its historical behavior:
Pine Script®
Key Features
Data Source:
Customization:
Signals:
Overbought/Oversold Conditions:
Visualizations:
Alerts:
Usage Guide
Trend Following
Overbought/Oversold Analysis
Timeframe
Interpretation
Conclusion
The Supply In Profit Z-Score indicator provides a robust, data-driven approach to analyzing cryptocurrency market trends and sentiment. By combining on-chain metrics with statistical normalization, it empowers traders to make informed decisions based on historical context and current market dynamics.
The Supply In Profit Z-Score indicator is a Pine Script™ tool developed by Vistula Labs for technical analysis of cryptocurrencies, specifically Bitcoin (BTC) and Ethereum (ETH). It utilizes on-chain data from IntoTheBlock to calculate the difference between the percentage of addresses in profit and those in loss, transforming this metric into a Z-Score. This indicator helps traders identify market sentiment, trend-following opportunities, and overbought or oversold conditions.
What is Supply In Profit?
Supply In Profit is defined as the net difference between the percentage of addresses in profit and those in loss:
- Profit Percentage: The proportion of addresses where the current value of holdings exceeds the acquisition price.
- Loss Percentage: The proportion of addresses where the current value is below the acquisition price.
A positive value indicates more addresses are in profit, suggesting bullish sentiment, while a negative value indicates widespread losses, hinting at bearish sentiment.
How It Works
The indicator computes a Z-Score to normalize the Supply In Profit data relative to its historical behavior:
Z-Score = (Current Supply In Profit - Moving Average of Supply In Profit) / Standard Deviation of Supply In Profit
- Current Supply In Profit: The latest profit-minus-loss percentage.
- Moving Average: A customizable average (e.g., EMA, SMA) over a default 180-bar period.
- Standard Deviation: Calculated over a default 200-bar lookback period.
Key Features
Data Source:
- Selectable between BTC and ETH, pulling daily profit/loss percentage data from IntoTheBlock.
Customization:
- Moving Average Type: Options include SMA, EMA, DEMA, RMA, WMA, or VWMA (default: EMA).
- Moving Average Length: Default is 180 bars.
- Z-Score Lookback: Default is 200 bars.
- Thresholds: Adjustable for long/short signals and overbought/oversold levels.
Signals:
- Long Signal: Z-Score crosses above the Long Threshold (default: 1.0).
- Short Signal: Z-Score crosses below the Short Threshold (default: -0.64).
Overbought/Oversold Conditions:
- Overbought: Z-Score > 3.0.
- Oversold: Z-Score < -2.0.
Visualizations:
- Z-Score Plot: Teal for long signals, magenta for short signals.
- Threshold Lines: Dashed lines for long/short, solid lines for overbought/oversold.
- Candlestick Coloring: Matches signal colors (teal/magenta).
- Arrows: Green up-triangles for long entries, red down-triangles for short entries.
- Background Colors: Magenta for overbought, teal for oversold.
Alerts:
- Conditions for Long Opportunity, Short Opportunity, Overbought, and Oversold.
Usage Guide
Trend Following
- Long Entry: When Z-Score crosses above 1.0, indicating potential upward momentum.
- Short Entry: When Z-Score crosses below -0.64, suggesting potential downward momentum.
Overbought/Oversold Analysis
- Overbought (Z-Score > 3.0): Consider profit-taking or preparing for a reversal.
- Oversold (Z-Score < -2.0): Look for buying opportunities or exiting shorts.
Timeframe
- Uses daily IntoTheBlock data, ideal for medium to long-term analysis.
Interpretation
- High Z-Score: Indicates Supply In Profit is significantly above its historical mean, potentially signaling overvaluation.
- Low Z-Score: Suggests Supply In Profit is below its mean, indicating possible undervaluation.
- Signals and thresholds help traders act on shifts in market sentiment or extreme conditions.
Conclusion
The Supply In Profit Z-Score indicator provides a robust, data-driven approach to analyzing cryptocurrency market trends and sentiment. By combining on-chain metrics with statistical normalization, it empowers traders to make informed decisions based on historical context and current market dynamics.
受保护脚本
此脚本以闭源形式发布。 但是,您可以自由使用,没有任何限制 — 了解更多信息这里。
免责声明
这些信息和出版物并非旨在提供,也不构成TradingView提供或认可的任何形式的财务、投资、交易或其他类型的建议或推荐。请阅读使用条款了解更多信息。
受保护脚本
此脚本以闭源形式发布。 但是,您可以自由使用,没有任何限制 — 了解更多信息这里。
免责声明
这些信息和出版物并非旨在提供,也不构成TradingView提供或认可的任何形式的财务、投资、交易或其他类型的建议或推荐。请阅读使用条款了解更多信息。