INVITE-ONLY SCRIPT
CVD Line + EMA
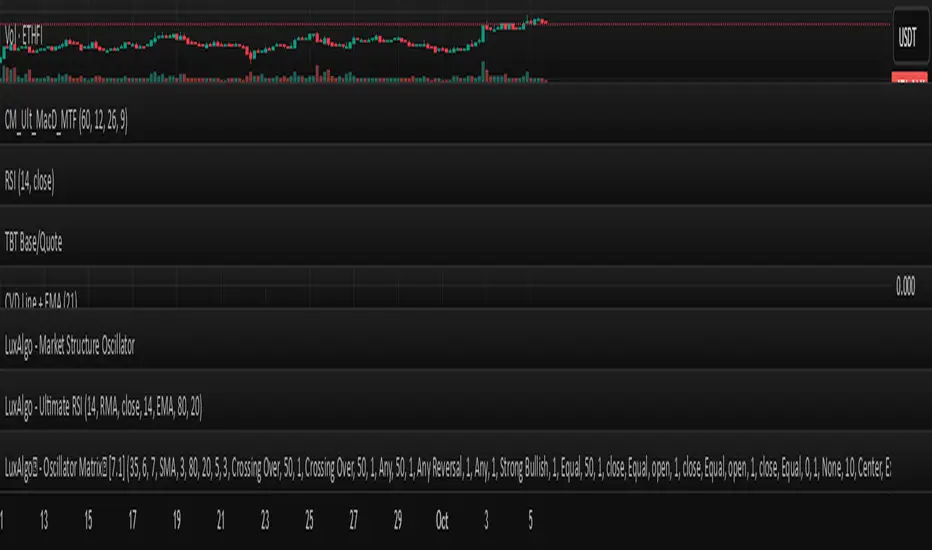
This indicator visualizes the Cumulative Volume Delta (CVD) as a line and overlays an Exponential Moving Average (EMA, default length 21) on the CVD. The CVD estimates buy/sell volume using candle direction, accumulating volume when price moves up or down. The EMA helps smooth the CVD, quickly signaling directional shifts that can indicate potential trend changes. The line turns green when CVD holds above its EMA (suggesting bullish pressure) and red when below (suggesting bearish pressure).
Settings allow users to customize the EMA period to suit different timeframes or trading strategies. The script is intended for educational purposes and is released under the Mozilla Public License 2.0. For best results, use in conjunction with other analysis and risk management tools.
Settings allow users to customize the EMA period to suit different timeframes or trading strategies. The script is intended for educational purposes and is released under the Mozilla Public License 2.0. For best results, use in conjunction with other analysis and risk management tools.
仅限邀请脚本
只有经作者批准的用户才能访问此脚本。您需要申请并获得使用权限。该权限通常在付款后授予。如需了解更多详情,请按照以下作者的说明操作,或直接联系MFH_BM。
除非您完全信任其作者并了解脚本的工作原理,否則TradingView不建议您付费或使用脚本。您还可以在我们的社区脚本中找到免费的开源替代方案。
作者的说明
This indicator plots the Cumulative Volume Delta (CVD) and overlays an adjustable Exponential Moving Average (EMA, default length 21) on it.
Adjust the EMA length in the settings as needed for your timeframe or asset.
免责声明
这些信息和出版物并不意味着也不构成TradingView提供或认可的金融、投资、交易或其它类型的建议或背书。请在使用条款阅读更多信息。