INVITE-ONLY SCRIPT
已更新 Candle Pressure Visualization
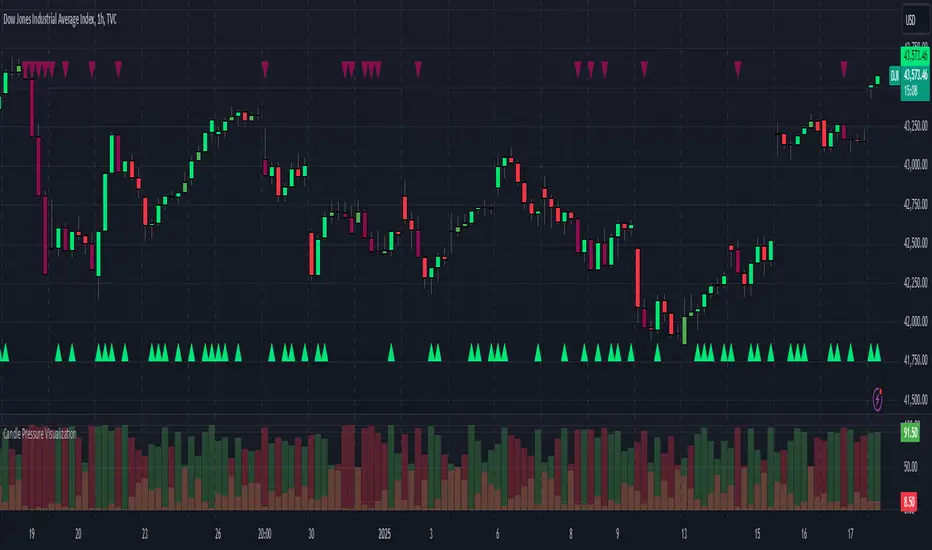
Candle Pressure Visualization:
This TradingView indicator visualizes buying and selling pressure, highlighting extreme market sentiment through custom thresholds, color-coded candles, and histograms.
Features Overview
Custom Thresholds:
Allows you to set thresholds for buying and selling pressure (default: 70 and 90).
Buying & Selling Pressure:
Calculates pressure based on the relative position of the close price to the high and low prices of the candle.
Color-Coded Candles:
Enhances candle colors to highlight extreme pressures.
Histograms:
Displays buying and selling pressure as columns.
Extreme Pressure Markers:
Adds visual markers for areas of strong buying or selling.
his script visualizes buying and selling pressure on a TradingView chart, giving a unique perspective on market sentiment. Here's a breakdown of its functionality:
Features
Inputs for Customization
Users can set thresholds for buying and selling pressure (default: 70 and 90, respectively).
Buying and Selling Pressure Calculation
Buying pressure is calculated as the relative distance of the close price from the low.
Selling pressure is the relative distance of the close price from the high.
Handles edge cases like doji candles (where high equals low) by assigning a neutral value of 50%.
Color-Coded Candles
Bullish candles: Enhanced with a bright green (lime) if buying pressure exceeds the threshold.
Bearish candles: Enhanced with a dark red (maroon) if selling pressure exceeds the threshold.
Neutral candles: Gray for doji or balanced sentiment.
Pressure Histograms
Displays buying and selling pressure as column-style histograms with semi-transparent green and red colors.
Markers for Extreme Pressure
Labels highlight areas of extreme buying or selling pressure using small markers at the top or bottom of the chart.
Alerts
Alerts are triggered when buying or selling pressure crosses user-defined thresholds, providing actionable notifications.
Optional Total Pressure Plot
A combined plot of total pressure (buying + selling) is hidden by default for simplicity but can be enabled if needed.
Disclaimer: The information contained in my Scripts/Indicators/Ideas/Systems does not constitute financial advice or a solicitation to buy or sell any securities of any type. I will not accept liability for any loss or damage, including without limitation any loss of profit, which may arise directly or indirectly from the use of or reliance on such information.
All investments involve risk, and the past performance of a security, industry, sector, market, financial product, trading strategy, back test, or individual's trading does not guarantee future results or returns. Investors are fully responsible for any investment decisions they make. Such decisions should be based solely on an evaluation of their financial circumstances, investment objectives, risk tolerance, and liquidity needs.
My Scripts/Indicators/Ideas/Systems are only for educational purposes!
版本注释
*** Minor update仅限邀请脚本
只有作者授权的用户才能访问此脚本。您需要申请并获得使用许可。通常情况下,付款后即可获得许可。更多详情,请按照下方作者的说明操作,或直接联系ask2maniish。
TradingView不建议您付费购买或使用任何脚本,除非您完全信任其作者并了解其工作原理。您也可以在我们的社区脚本找到免费的开源替代方案。
作者的说明
Access to this script is restricted to users authorized by the author and usually requires payment. You can add it to your favorites, but you will only be able to use it after requesting permission and obtaining it from author. E-mail:ask2maniish@gmal.com
免责声明
这些信息和出版物并非旨在提供,也不构成TradingView提供或认可的任何形式的财务、投资、交易或其他类型的建议或推荐。请阅读使用条款了解更多信息。
仅限邀请脚本
只有作者授权的用户才能访问此脚本。您需要申请并获得使用许可。通常情况下,付款后即可获得许可。更多详情,请按照下方作者的说明操作,或直接联系ask2maniish。
TradingView不建议您付费购买或使用任何脚本,除非您完全信任其作者并了解其工作原理。您也可以在我们的社区脚本找到免费的开源替代方案。
作者的说明
Access to this script is restricted to users authorized by the author and usually requires payment. You can add it to your favorites, but you will only be able to use it after requesting permission and obtaining it from author. E-mail:ask2maniish@gmal.com
免责声明
这些信息和出版物并非旨在提供,也不构成TradingView提供或认可的任何形式的财务、投资、交易或其他类型的建议或推荐。请阅读使用条款了解更多信息。