INVITE-ONLY SCRIPT
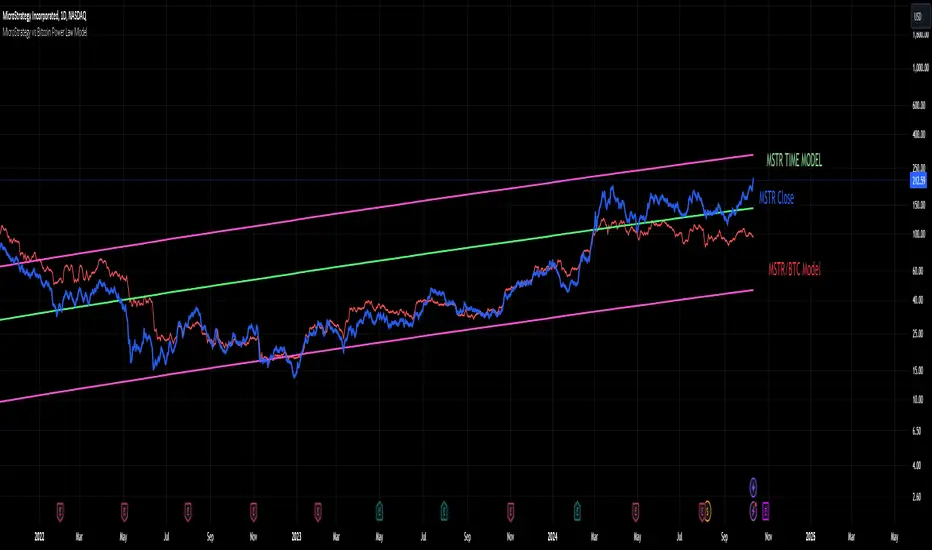
MicroStrategy vs Bitcoin Power Law Model

This indicator provides a powerful tool for investors by modeling the relationship between MicroStrategy (MSTR) and Bitcoin (BTC) based on an observed power law correlation since August 2020, when MSTR adopted Bitcoin as its core investment strategy. The primary objective of the indicator is to identify areas where MSTR is overvalued or undervalued relative to BTC, offering investors crucial insights for making informed decisions.
Step-by-Step Creation Process:
Data Collection:
The indicator begins by gathering historical price data for both MSTR and BTC starting from August 2020. This period is significant as it marks MSTR’s strategic shift toward Bitcoin acquisition.
Power Law Analysis:
A power law relationship between MSTR and BTC is computed using a power of 1.3. This relationship models the price behavior of MSTR relative to BTC, providing a framework to track where MSTR’s price deviates from its expected value based on BTC's movements.
MSTR Price Model:
The MSTR price model based on this power law is then plotted against the actual price of MSTR. This allows investors to visualize areas where MSTR is potentially overvalued or undervalued relative to BTC.
Overvaluation is highlighted when the actual MSTR price exceeds the power law-based price, while undervaluation is noted when it falls below.
Time-Based Power Law Model:
Additionally, the indicator integrates a time-based model for MSTR, which shows that MSTR follows its own power law over time with a higher slope than BTC (7.2 vs. 5.8). This comparison provides further context, showing how MSTR's growth rate differs from BTC’s over time.
Oscillator Inclusion:
To complement the price models, an oscillator is added, which tracks the difference between the MSTR power law and the BTC power law. This oscillator helps visualize and quantify the divergence between the two, offering a clearer picture of periods where MSTR is performing above or below expectations compared to BTC.
Indicator Usefulness:
Overvaluation and Undervaluation Detection: By comparing MSTR’s current price against its expected power law-based price, investors can easily identify potential entry and exit points. When MSTR is overvalued relative to BTC, it may signal an opportunity to sell or reduce exposure. Conversely, undervaluation may suggest a buying opportunity.
Time-Based Growth Comparisons: The time-based power law model shows how MSTR has been growing relative to Bitcoin over time. This helps investors understand whether MSTR is outperforming or underperforming BTC in the long run.
Divergence Oscillator: The oscillator provides an intuitive way to gauge whether MSTR is significantly diverging from BTC’s growth trajectory, offering an additional signal to guide investment decisions.
Projections to the future
Projections of the MSTR power law to 500 days ahead is also included.
Why is this Indicator Useful for Investors?
This indicator offers a comprehensive view of how MSTR’s price behavior correlates with Bitcoin. By leveraging the power law relationship, it provides insight into whether MSTR is priced appropriately relative to BTC, which is especially valuable for those with exposure to both assets. The oscillator further refines this analysis by highlighting periods of divergence, offering potential trading opportunities based on relative value.
仅限邀请脚本
只有作者授权的用户才能访问此脚本。您需要申请并获得使用许可。通常情况下,付款后即可获得许可。更多详情,请按照下方作者的说明操作,或直接联系Quantonomyfund。
TradingView不建议您付费购买或使用任何脚本,除非您完全信任其作者并了解其工作原理。您也可以在我们的社区脚本找到免费的开源替代方案。
作者的说明
Please check instructions on how to obtain the indicator following the link below:
https://bitposeidon.com/power-law-indicators
免责声明
这些信息和出版物并非旨在提供,也不构成TradingView提供或认可的任何形式的财务、投资、交易或其他类型的建议或推荐。请阅读使用条款了解更多信息。