PROTECTED SOURCE SCRIPT
GFG Turtle Soup
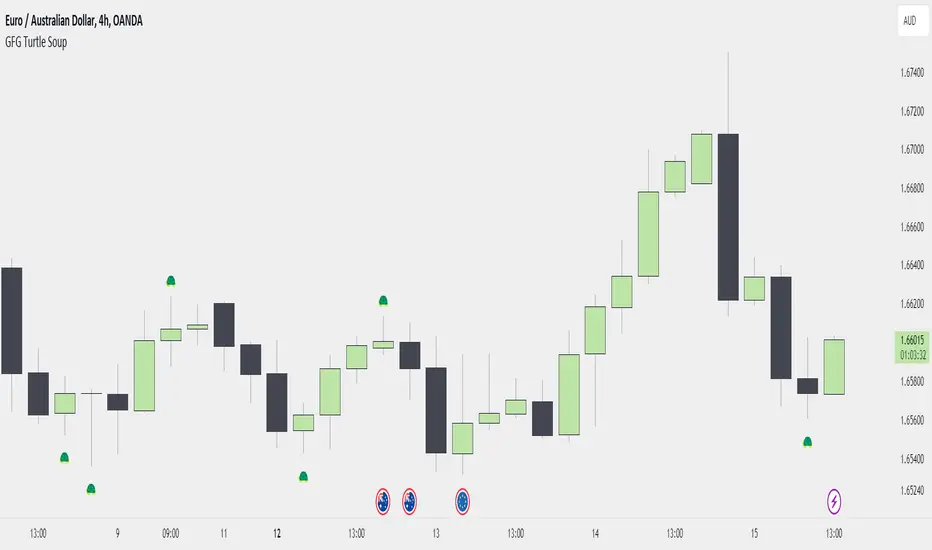
The GFG Turtle Soup indicator is a custom script designed to identify potential reversal points in the market by detecting specific price patterns over a user-defined lookback period. This indicator is based on the "Turtle Soup" strategy, which aims to exploit false breakouts and generate buy or sell signals when certain conditions are met.
Key Features:
Lookback Period: The indicator examines a user-defined period (default is 5 bars) to determine the highest high or lowest low, crucial for identifying potential reversal zones.
Signal Characters: The indicator provides visual cues on the chart using customizable characters (default is a turtle emoji 🐢) to mark potential bullish or bearish setups.
Pattern Detection:
Bearish Signal: A potential sell signal is generated when the current bar makes a higher high, but the close is lower than the high of the previous bar, signaling a possible reversal after a false breakout to the upside.
Bullish Signal: A potential buy signal is generated when the current bar makes a lower low, but the close is higher than the low of the previous bar, indicating a possible reversal after a false breakout to the downside.
Visual and Alert System: The indicator not only marks the signals on the chart but also triggers alerts, allowing traders to take action promptly on lower timeframes.
This indicator is particularly useful for traders looking to identify reversal points where price may have overextended in one direction, providing opportunities to enter the market in the opposite direction.
受保护脚本
此脚本以闭源形式发布。 但是,您可以自由使用,没有任何限制 — 了解更多信息这里。
免责声明
这些信息和出版物并非旨在提供,也不构成TradingView提供或认可的任何形式的财务、投资、交易或其他类型的建议或推荐。请阅读使用条款了解更多信息。
免责声明
这些信息和出版物并非旨在提供,也不构成TradingView提供或认可的任何形式的财务、投资、交易或其他类型的建议或推荐。请阅读使用条款了解更多信息。