OPEN-SOURCE SCRIPT
Range over Volume
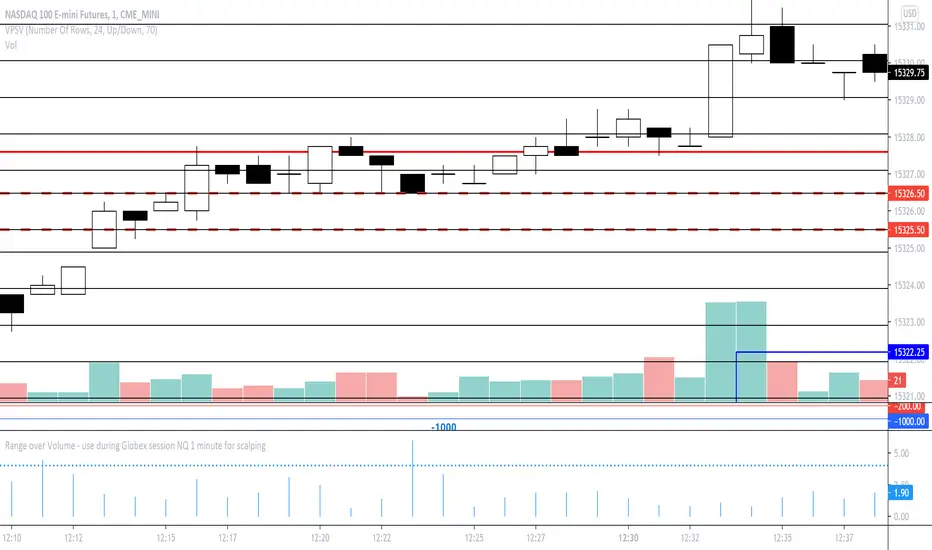
This is a scalping aid for NQ in the 1 minute time range for the Globex session.
Mathematically, the plot is range in ticks divided by 0.1*volume
This returns a histogram plot for RoV (range over volume)
The idea is that candles that ascribe a larger range with minimal volume does because there is unilateral aggression from the buy side, or sell side, and the subsequent behavioural outcome of this will either be an extension of that aggression unilaterally, or commonly, a counter to that aggression!
Wait for a candle to close with the RoV above 4.00. For that candle which formed the RoV above 4.00, plot the highs and lows of that candle and draw a 1.618x and -0.618x Fibonacci extension across it.
Enter short on the -0.618x and take profits at the -1.618x. Use the low of the ROV > 4 candle as a protective stop
Enter long on the 1.618 and take profits at 2.618. Use the high of the ROV > 4 candle as a protective stop
开源脚本
秉承TradingView的精神,该脚本的作者将其开源,以便交易者可以查看和验证其功能。向作者致敬!您可以免费使用该脚本,但请记住,重新发布代码须遵守我们的网站规则。
免责声明
这些信息和出版物并非旨在提供,也不构成TradingView提供或认可的任何形式的财务、投资、交易或其他类型的建议或推荐。请阅读使用条款了解更多信息。
开源脚本
秉承TradingView的精神,该脚本的作者将其开源,以便交易者可以查看和验证其功能。向作者致敬!您可以免费使用该脚本,但请记住,重新发布代码须遵守我们的网站规则。
免责声明
这些信息和出版物并非旨在提供,也不构成TradingView提供或认可的任何形式的财务、投资、交易或其他类型的建议或推荐。请阅读使用条款了解更多信息。