OPEN-SOURCE SCRIPT
已更新 Master Simple Indicator
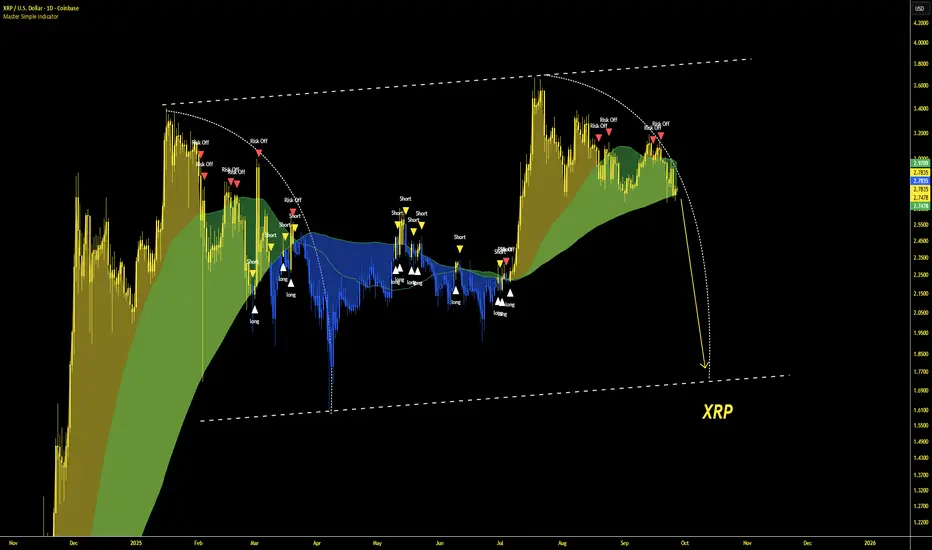
The streamlined Pine Script, created by masterbtcltc, is a technical analysis indicator that overlays on a price chart to provide buy and sell signals based on a dynamic 120-day simple moving average (SMA). Here's how it works:
Dynamic Moving Average: Calculates a 120-day SMA (ma_dynamic) using closing prices to smooth out price fluctuations and identify trends.
Buy/Sell Signals:
Buy Signal: Triggered when the closing price crosses above the 120-day SMA (longSignal), indicating potential bullish momentum. A white triangle with "close" text appears below the bar.
Sell Signal: Triggered when the closing price crosses below the 120-day SMA (shortSignal), suggesting bearish momentum. A yellow triangle with "Short" text appears above the bar.
Alerts: Generates alerts for buy (Long Signal Alert) and sell (Short Signal Alert) signals, notifying users when the price crosses the SMA.
Visual Highlights:
Price vs. SMA: The area between the closing price and the 120-day SMA is filled with yellow if the price is above the SMA (bullish) or blue if below (bearish).
50-day vs. 120-day SMA: The area between the 50-day SMA and 120-day SMA is filled green when the 50-day SMA is above the 120-day SMA, indicating a stronger bullish trend.
Created by masterbtcltc, this indicator helps traders identify trend changes and potential entry/exit points based on price interactions with the 120-day SMA, with clear visual cues and alerts for decision-making.
版本注释
text change版本注释
added risk off and candle color changes so hide the main asset开源脚本
秉承TradingView的精神,该脚本的作者将其开源,以便交易者可以查看和验证其功能。向作者致敬!您可以免费使用该脚本,但请记住,重新发布代码须遵守我们的网站规则。
免责声明
这些信息和出版物并非旨在提供,也不构成TradingView提供或认可的任何形式的财务、投资、交易或其他类型的建议或推荐。请阅读使用条款了解更多信息。
开源脚本
秉承TradingView的精神,该脚本的作者将其开源,以便交易者可以查看和验证其功能。向作者致敬!您可以免费使用该脚本,但请记住,重新发布代码须遵守我们的网站规则。
免责声明
这些信息和出版物并非旨在提供,也不构成TradingView提供或认可的任何形式的财务、投资、交易或其他类型的建议或推荐。请阅读使用条款了解更多信息。