OPEN-SOURCE SCRIPT
K線虛擬幣
// This source code is subject to the terms of the Mozilla Public License 2.0 at mozilla.org/MPL/2.0/
// © dear.simpson
//version=5
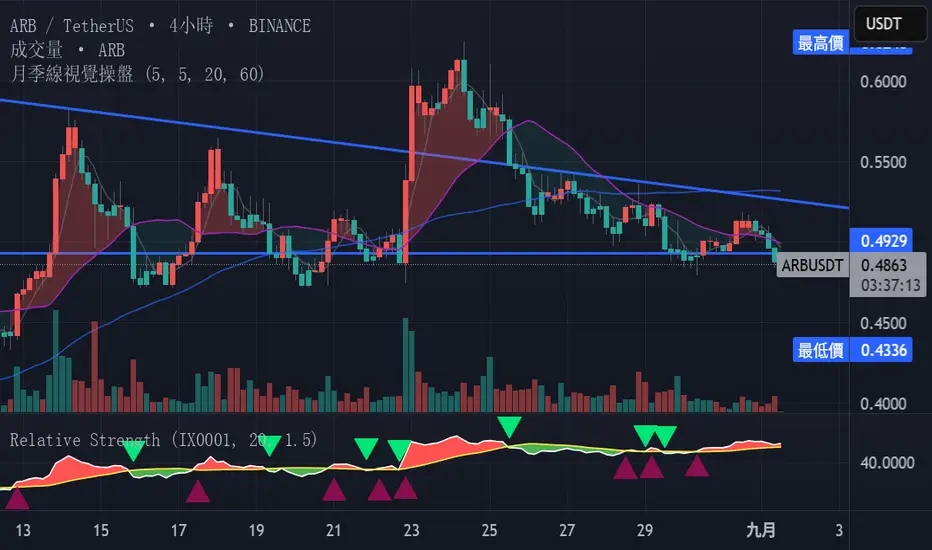
indicator("月季線視覺操盤", "", true)
// Getting inputs
length = input(5, "操盤線週期")
// Calculating
ma = ta.sma(close, length)
spread = close-ma
// Plotcandle
plotcandle(open, high, low, close, title='操盤K線', editable = false , display =display.pane+display.price_scale , color = (spread>=0 ? #ef5350 : #26a69a) , bordercolor= (spread>=0 ? #ef5350 : #26a69a) , wickcolor = #5d606b)
// Getting inputs
maPeriods1 = input( 5 , "MA 1" , group="移動平均線")
maPeriods2 = input(20 , "MA 2" , group="移動平均線")
maPeriods3 = input(60 , "MA 3" , group="移動平均線")
line0 = ta.sma(close, 2)
line1 = ta.sma(close, maPeriods1)
line2 = ta.sma(close, maPeriods2)
line3 = ta.sma(close, maPeriods3)
// Plot Moving Average Line
p0PlotID = plot(line0 ,"MA 0" , color.new(color.black ,100), display = display.none , editable = false)
p1PlotID = plot(line1 ,"MA 1" , color.new(#787b86, 50), display = display.pane+display.price_scale )
p2PlotID = plot(line2 ,"MA 2" , color.new(#787b86, 0), display = display.pane+display.price_scale )
p3PlotID = plot(line3 ,"MA 3" , color.new(color.blue , 30), display = display.pane+display.price_scale )
// Plot Zone Color
fill(p0PlotID, p2PlotID, close > line2 ? color.new(#ef5350, 70) : color.new(#26a69a, 90), '高/低於月線區域顏色')
fill(p0PlotID, p3PlotID, close > line3 ? color.new(#ef5350, 70) : color.new(#26a69a, 90), '高/低於季線區域顏色' , display = display.none )
// © dear.simpson
//version=5
indicator("月季線視覺操盤", "", true)
// Getting inputs
length = input(5, "操盤線週期")
// Calculating
ma = ta.sma(close, length)
spread = close-ma
// Plotcandle
plotcandle(open, high, low, close, title='操盤K線', editable = false , display =display.pane+display.price_scale , color = (spread>=0 ? #ef5350 : #26a69a) , bordercolor= (spread>=0 ? #ef5350 : #26a69a) , wickcolor = #5d606b)
// Getting inputs
maPeriods1 = input( 5 , "MA 1" , group="移動平均線")
maPeriods2 = input(20 , "MA 2" , group="移動平均線")
maPeriods3 = input(60 , "MA 3" , group="移動平均線")
line0 = ta.sma(close, 2)
line1 = ta.sma(close, maPeriods1)
line2 = ta.sma(close, maPeriods2)
line3 = ta.sma(close, maPeriods3)
// Plot Moving Average Line
p0PlotID = plot(line0 ,"MA 0" , color.new(color.black ,100), display = display.none , editable = false)
p1PlotID = plot(line1 ,"MA 1" , color.new(#787b86, 50), display = display.pane+display.price_scale )
p2PlotID = plot(line2 ,"MA 2" , color.new(#787b86, 0), display = display.pane+display.price_scale )
p3PlotID = plot(line3 ,"MA 3" , color.new(color.blue , 30), display = display.pane+display.price_scale )
// Plot Zone Color
fill(p0PlotID, p2PlotID, close > line2 ? color.new(#ef5350, 70) : color.new(#26a69a, 90), '高/低於月線區域顏色')
fill(p0PlotID, p3PlotID, close > line3 ? color.new(#ef5350, 70) : color.new(#26a69a, 90), '高/低於季線區域顏色' , display = display.none )
开源脚本
秉承TradingView的精神,该脚本的作者将其开源,以便交易者可以查看和验证其功能。向作者致敬!您可以免费使用该脚本,但请记住,重新发布代码须遵守我们的网站规则。
免责声明
这些信息和出版物并非旨在提供,也不构成TradingView提供或认可的任何形式的财务、投资、交易或其他类型的建议或推荐。请阅读使用条款了解更多信息。
免责声明
这些信息和出版物并非旨在提供,也不构成TradingView提供或认可的任何形式的财务、投资、交易或其他类型的建议或推荐。请阅读使用条款了解更多信息。