OPEN-SOURCE SCRIPT
已更新 Percentage Range Consolidation Histogram
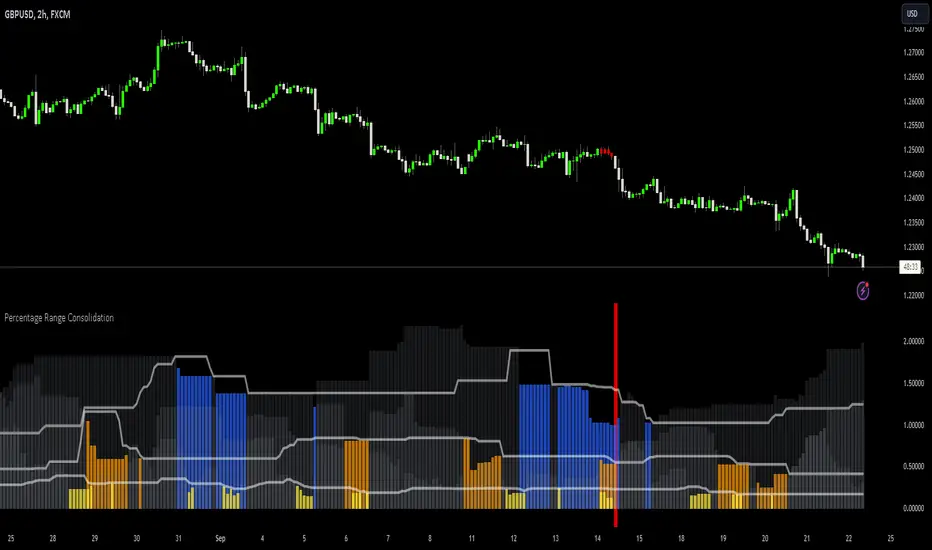
The Percentage Range Consolidation histogram is a measure of volatility, ranking current price range compared to past ranges.
🟩 USAGE

Here there are 2 heavy contractions of price shown on chart that lead to a big rally. Shows a possible way to approach trading this. Take into account that this is for illustration purposes only and these entry methods have not been tested for long term profitability.

Same price behaviour.
🟩 CALCULATION
The script will use 3 different ranges all configurable by the user to check for low volatility on different zone lengths. On default zone 1 will be 10 period, 2 will be 30 period and 3 is 50 periods long.
It will then measure the percentage these ranges have from top (highest close) to bottom (lowest close) and plot those numbers as 3 gray histograms.
For each of these histograms separately it will use 'percentage zone PNR Length setting' as a lookback to rank current zone percentage compared to past results.
How it will do that is using the 'percentage zone PNR % setting' it will draw a line using ta.percentile_nearest_rank() formula. At default this is 20% meaning that only 20% of lookback values where below this level.
When the histogram is below this white line (small range compared to past ranges) it will color the histogram. Yellow for zone 1, orange for zone 2 and blue for zone 3.
There is also a 'Percentage zone % filter' which you can use as a maximum % current zone for it to be considered a small range. On default this is set to 15%. You can turn this off by selecting 'median' as 'Consolidation filters' instead of 'all'. Or only use this by selecting 'percentage'
🟩 BAR COLORING
Now that you understand how to find small ranges (contractions of price) with the indicator there is a bar coloring option in the indicator.
You can select how many of the 3 zones have to be ranging for it to color the bar. On default this is set to 3 so the script will only color when price is in a very small range. As illustrated by the above charts these can lead to the beginnings of big trends.
🟩 USAGE
Here there are 2 heavy contractions of price shown on chart that lead to a big rally. Shows a possible way to approach trading this. Take into account that this is for illustration purposes only and these entry methods have not been tested for long term profitability.
Same price behaviour.
🟩 CALCULATION
The script will use 3 different ranges all configurable by the user to check for low volatility on different zone lengths. On default zone 1 will be 10 period, 2 will be 30 period and 3 is 50 periods long.
It will then measure the percentage these ranges have from top (highest close) to bottom (lowest close) and plot those numbers as 3 gray histograms.
For each of these histograms separately it will use 'percentage zone PNR Length setting' as a lookback to rank current zone percentage compared to past results.
How it will do that is using the 'percentage zone PNR % setting' it will draw a line using ta.percentile_nearest_rank() formula. At default this is 20% meaning that only 20% of lookback values where below this level.
When the histogram is below this white line (small range compared to past ranges) it will color the histogram. Yellow for zone 1, orange for zone 2 and blue for zone 3.
There is also a 'Percentage zone % filter' which you can use as a maximum % current zone for it to be considered a small range. On default this is set to 15%. You can turn this off by selecting 'median' as 'Consolidation filters' instead of 'all'. Or only use this by selecting 'percentage'
🟩 BAR COLORING
Now that you understand how to find small ranges (contractions of price) with the indicator there is a bar coloring option in the indicator.
You can select how many of the 3 zones have to be ranging for it to color the bar. On default this is set to 3 so the script will only color when price is in a very small range. As illustrated by the above charts these can lead to the beginnings of big trends.
版本注释
As requested by a user added alerts to the script and show them in script.- "Consolidation start" - Alerts when a new consolidation area is created.
- "breaks top of range" - Alerts when closing price closes above top of consolidation range.
- "breaks bottom of range" - Alerts when closing price closes below bottom of consolidation range.
In case the break alerts are confusing here is a visual on how it works. Script will track highest highs and lowest lows in last consolidation area (as seen by red candles). When price is no longer consolidating and closes beyond one of these lines it removes them and sends an alert.
版本注释
Changed background coloring for breaks to be red for short pressure and green for long pressure开源脚本
秉承TradingView的精神,该脚本的作者将其开源,以便交易者可以查看和验证其功能。向作者致敬!您可以免费使用该脚本,但请记住,重新发布代码须遵守我们的网站规则。
✅ Let me help you become profitable long-term.
Patreon -> patreon.com/ChartMuse
Patreon -> patreon.com/ChartMuse
✅ Work with me:
Form -> forms.gle/caAJxCNTP4CqjFy4A
Form -> forms.gle/caAJxCNTP4CqjFy4A
Patreon -> patreon.com/ChartMuse
Patreon -> patreon.com/ChartMuse
✅ Work with me:
Form -> forms.gle/caAJxCNTP4CqjFy4A
Form -> forms.gle/caAJxCNTP4CqjFy4A
免责声明
这些信息和出版物并非旨在提供,也不构成TradingView提供或认可的任何形式的财务、投资、交易或其他类型的建议或推荐。请阅读使用条款了解更多信息。
开源脚本
秉承TradingView的精神,该脚本的作者将其开源,以便交易者可以查看和验证其功能。向作者致敬!您可以免费使用该脚本,但请记住,重新发布代码须遵守我们的网站规则。
✅ Let me help you become profitable long-term.
Patreon -> patreon.com/ChartMuse
Patreon -> patreon.com/ChartMuse
✅ Work with me:
Form -> forms.gle/caAJxCNTP4CqjFy4A
Form -> forms.gle/caAJxCNTP4CqjFy4A
Patreon -> patreon.com/ChartMuse
Patreon -> patreon.com/ChartMuse
✅ Work with me:
Form -> forms.gle/caAJxCNTP4CqjFy4A
Form -> forms.gle/caAJxCNTP4CqjFy4A
免责声明
这些信息和出版物并非旨在提供,也不构成TradingView提供或认可的任何形式的财务、投资、交易或其他类型的建议或推荐。请阅读使用条款了解更多信息。