OPEN-SOURCE SCRIPT
EMA FAST-SLOW
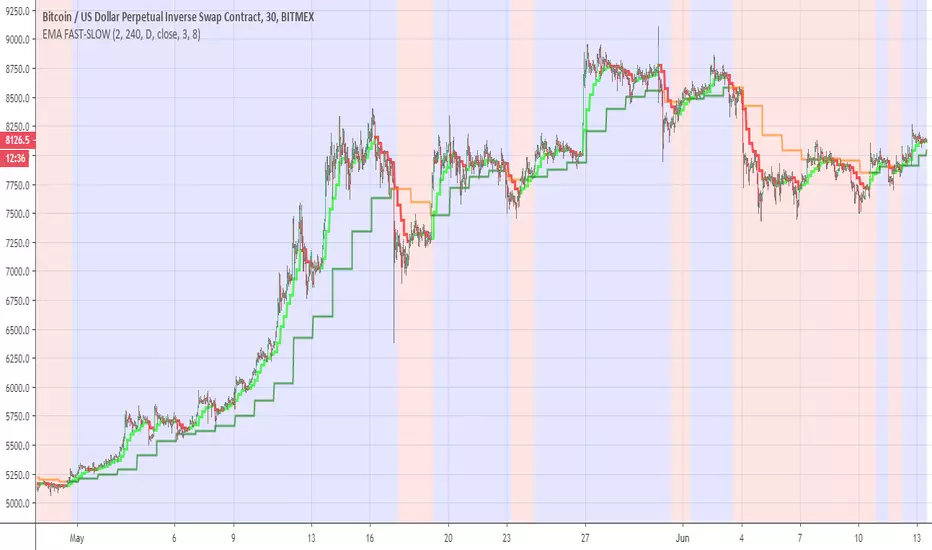
This indicator has the following
ema fast (length 3 and 8 ) based on 240 min
ema slow (length 3 and 8 ) based on daily MTF
The reason for the two length in each EMA is to give us the the insight of shorter trend in larger trend
so the large trend is when ema fast 240 min is above the daily ema slow this is shown in the bullish or bearish zones
the smaler trend for each MTF is shown in different color (lime:red) for ema fast 240 min , and (green:orange) for the slow daily EMA
when we this setting on smaller time frame so it more easy to see where the asset is going this the basic idea
you can change the setting as you wish in oreder to find the best one for your time frame
开源脚本
秉承TradingView的精神,该脚本的作者将其开源,以便交易者可以查看和验证其功能。向作者致敬!您可以免费使用该脚本,但请记住,重新发布代码须遵守我们的网站规则。
免责声明
这些信息和出版物并非旨在提供,也不构成TradingView提供或认可的任何形式的财务、投资、交易或其他类型的建议或推荐。请阅读使用条款了解更多信息。
开源脚本
秉承TradingView的精神,该脚本的作者将其开源,以便交易者可以查看和验证其功能。向作者致敬!您可以免费使用该脚本,但请记住,重新发布代码须遵守我们的网站规则。
免责声明
这些信息和出版物并非旨在提供,也不构成TradingView提供或认可的任何形式的财务、投资、交易或其他类型的建议或推荐。请阅读使用条款了解更多信息。