PROTECTED SOURCE SCRIPT
已更新 ICT & Zeussy Macro - Vertical Lines at Specific Times 1.0
# ICT & Zeussy Macro - Vertical Lines at Specific Times 1.0
## Description
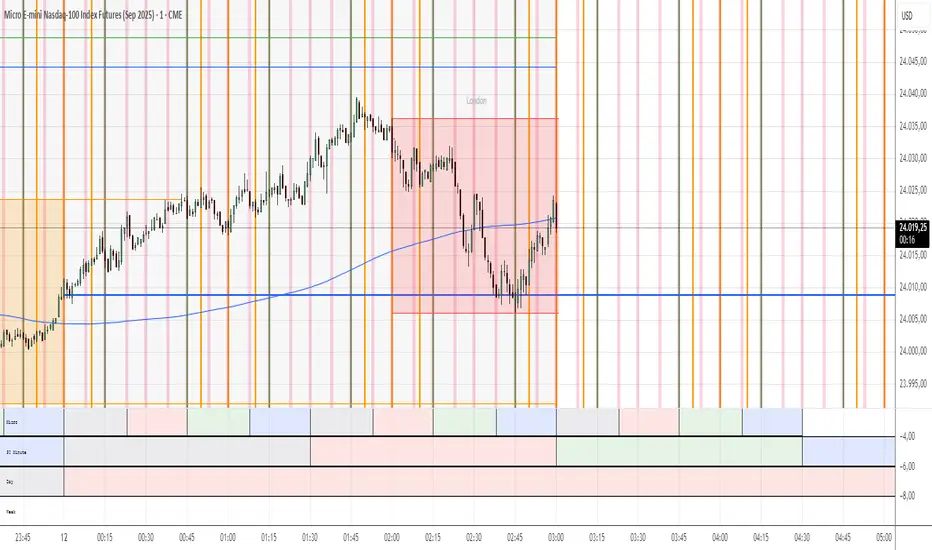
The **ICT & Zeussy Macro - Vertical Lines at Specific Times 1.0** is a Pine Script indicator designed for TradingView to plot vertical lines at user-defined times within each hour, making it a valuable tool for traders following ICT (Inner Circle Trader) and Zeussy macro strategies. The indicator allows users to mark specific times during the trading day with customizable vertical lines, helping to highlight key market moments such as macro times for analysis or trade planning.
## Key Features
- **Customizable Time Selection**: Choose specific hours (00:00 to 23:00) to display vertical lines using checkboxes in the settings.
- **Flexible Minute Inputs**: Define exact minutes for green and orange lines using comma-separated values (e.g., "45,15" for green lines at :45 and :15, or "50,0,10" for orange lines at :50, :00, :10).
- **Color and Style Customization**: Select colors for green and orange lines, as well as the line style (Solid, Dashed, or Dotted) to suit your chart preferences.
- **Historical and Future Plotting**: Configure the number of past and future days to display lines, allowing for analysis of historical patterns or planning for upcoming sessions.
- **Line Limit Management**: The indicator supports up to 500 lines to comply with TradingView's limits, with a warning label displayed if the maximum is reached.
## How It Works
The indicator plots vertical lines at specified minutes within selected hours for each chosen day:
- **Green Lines**: Drawn at user-defined minutes (default: :45 and :15 past the hour).
- **Orange Lines**: Drawn at user-defined minutes (default: :50, :00, and :10 past the hour).
- Users can enable or disable specific hours via checkboxes, and the lines are plotted for the specified number of past and future days.
- The indicator uses the chart's timezone to ensure accurate placement of lines relative to the market's session times.
## Usage
1. **Add to Chart**: Apply the indicator to your TradingView chart.
2. **Configure Settings**:
- In the "Hour Selection" group, check the boxes for the hours you want to display lines (e.g., 08:00 to 23:00 are enabled by default).
- In the "Green Minutes" and "Orange Minutes" fields, enter comma-separated minute values (e.g., "45,15" for green, "50,0,10" for orange).
- Adjust the "Days in Past" and "Days in Future" to control how many days the lines will cover.
- Customize the "Green Color", "Orange Color", and "Line Style" to match your chart aesthetics.
3. **Monitor Limits**: If you see a "Line limit reached (500 max)" warning, reduce the number of selected hours or days to stay within TradingView's line limit.
## Ideal For
- Traders using ICT or Zeussy macro strategies to identify key times for market analysis.
- Users who need to mark recurring time-based events on their charts.
- Technical analysts looking to visualize specific time intervals across multiple days.
## Notes
- Ensure that the number of selected hours and days does not exceed TradingView's 500-line limit to avoid missing lines.
- The indicator respects the chart's timezone, so verify that your chart's timezone aligns with your trading session.
- For optimal performance, limit the number of past and future days when using multiple hours to avoid hitting the line limit.
This indicator is perfect for traders who rely on precise timing for their strategies, offering a clean and customizable way to visualize critical market moments.
## Description
The **ICT & Zeussy Macro - Vertical Lines at Specific Times 1.0** is a Pine Script indicator designed for TradingView to plot vertical lines at user-defined times within each hour, making it a valuable tool for traders following ICT (Inner Circle Trader) and Zeussy macro strategies. The indicator allows users to mark specific times during the trading day with customizable vertical lines, helping to highlight key market moments such as macro times for analysis or trade planning.
## Key Features
- **Customizable Time Selection**: Choose specific hours (00:00 to 23:00) to display vertical lines using checkboxes in the settings.
- **Flexible Minute Inputs**: Define exact minutes for green and orange lines using comma-separated values (e.g., "45,15" for green lines at :45 and :15, or "50,0,10" for orange lines at :50, :00, :10).
- **Color and Style Customization**: Select colors for green and orange lines, as well as the line style (Solid, Dashed, or Dotted) to suit your chart preferences.
- **Historical and Future Plotting**: Configure the number of past and future days to display lines, allowing for analysis of historical patterns or planning for upcoming sessions.
- **Line Limit Management**: The indicator supports up to 500 lines to comply with TradingView's limits, with a warning label displayed if the maximum is reached.
## How It Works
The indicator plots vertical lines at specified minutes within selected hours for each chosen day:
- **Green Lines**: Drawn at user-defined minutes (default: :45 and :15 past the hour).
- **Orange Lines**: Drawn at user-defined minutes (default: :50, :00, and :10 past the hour).
- Users can enable or disable specific hours via checkboxes, and the lines are plotted for the specified number of past and future days.
- The indicator uses the chart's timezone to ensure accurate placement of lines relative to the market's session times.
## Usage
1. **Add to Chart**: Apply the indicator to your TradingView chart.
2. **Configure Settings**:
- In the "Hour Selection" group, check the boxes for the hours you want to display lines (e.g., 08:00 to 23:00 are enabled by default).
- In the "Green Minutes" and "Orange Minutes" fields, enter comma-separated minute values (e.g., "45,15" for green, "50,0,10" for orange).
- Adjust the "Days in Past" and "Days in Future" to control how many days the lines will cover.
- Customize the "Green Color", "Orange Color", and "Line Style" to match your chart aesthetics.
3. **Monitor Limits**: If you see a "Line limit reached (500 max)" warning, reduce the number of selected hours or days to stay within TradingView's line limit.
## Ideal For
- Traders using ICT or Zeussy macro strategies to identify key times for market analysis.
- Users who need to mark recurring time-based events on their charts.
- Technical analysts looking to visualize specific time intervals across multiple days.
## Notes
- Ensure that the number of selected hours and days does not exceed TradingView's 500-line limit to avoid missing lines.
- The indicator respects the chart's timezone, so verify that your chart's timezone aligns with your trading session.
- For optimal performance, limit the number of past and future days when using multiple hours to avoid hitting the line limit.
This indicator is perfect for traders who rely on precise timing for their strategies, offering a clean and customizable way to visualize critical market moments.
版本注释
Explanation of the Indicator: ICT & Zeussy Macro - Vertical Lines at Specific TimesI extend my heartfelt thanks to Michael J. Huddleston (The Inner Circle Trader) for his groundbreaking work and tireless dedication, empowering traders worldwide with Smart Money Concepts (SMC). I also give a huge thank you to Zeussy (@zeussy_mmxm) for his outstanding contributions, enhancing ICT with precise time cycles. I wish both continued success and all the best!
Based on my comprehensive search of the web and X (formerly Twitter), I’ve explored ICT Macros and Zeussy Macros to provide context for this indicator. These concepts are rooted in algorithmic trading and SMC, focusing on high-probability time-based trading opportunities. Below, I explain what these macros are and how the ICT & Zeussy Macro - Vertical Lines at Specific Times (Version 1.5) indicator helps you apply them effectively in TradingView.
1. What Are ICT Macros and Zeussy Macros?
ICT Macros (Inner Circle Trader): Developed by Michael J. Huddleston, ICT Macros refer to short, high-volatility time windows (10–40 minutes) where algorithms (e.g., market makers) seek liquidity, fill Fair Value Gaps (FVG), or correct price imbalances. These are ideal for day trading in futures (e.g., NQ, ES) or forex. Typical times:
AM Macros: e.g., 9:45–10:15 AM NY time (often 10–15 minutes before/after the hour).
PM Macros: e.g., from 2:00 PM NY time for afternoon setups.
No macros in the Asian session; focus on London/NY overlap.
Sources: My web searches and X posts (e.g., @I_Am_The_ICT) highlight macros for Liquidity Sweeps, Order Blocks (OB), or Break of Structure (BOS). Traders praise their precision for quick trades.
Zeussy Macros: Zeussy (@zeussy_mmxm) builds on ICT, emphasizing time-based cycles (e.g., 90-minute or 10-minute cycles) tied to market behavior. His macros target reversal points or low-resistance liquidity runs. Examples:
90-minute cycles for MMSM (Market Maker Sell/Buy Model).
Windows like 9:45–10:15 AM or 15 minutes before/after the hour (e.g., 10:50, 11:00).
Sources: On X and YouTube, Zeussy’s trades are lauded as “insanely precise” (e.g., @zeussy_mmxm posts). His approach integrates SMT (Smart Money Tool) and algo signatures.
Both concepts help anticipate algorithmic patterns. Macros are volatile periods, often tied to news or session starts, perfect for high-probability setups.
2. What Does the Indicator Do?
The ICT & Zeussy Macro - Vertical Lines at Specific Times (Version 1.5) is a TradingView overlay indicator that draws vertical lines at user-defined times to visualize ICT and Zeussy Macros. It:
Draws two line types: Line 1 (e.g., AM Macros, default green) and Line 2 (e.g., PM Macros, default orange).
Marks specific hours/minutes (e.g., 08:45, 08:15 for Line 1; 08:50, 08:00, 08:10 for Line 2).
Spans past/future days for backtesting or planning.
Is customizable: Hours, minutes, color, style (Solid, Dashed, Dotted), and width per line type.
Lines extend vertically across the chart (extend.both) to highlight price action during macro times (e.g., volatility spikes or FVGs).
3. How to Use the Indicator? Step-by-Step Guide
The indicator is optimized for 5-minute, 15-minute, or 1-hour timeframes (avoid <5 min due to timestamp precision). It uses the chart’s timezone (e.g., NY time for futures).
Step 1: Installation
Copy the PineScript code into the TradingView Pine Editor.
Add the indicator to your chart (max 500 lines for performance).
Step 2: Adjust Settings
Settings are organized into two groups—Line 1 Settings followed by Line 2 Settings—for clarity:
General (top):
Show Hour XX: Enable hours (e.g., 08–18 for NY session; default: 08–23 enabled).
Days in Past/Future: e.g., 5 days back, 1 day forward for historical/future macros.
Line 1 Settings (e.g., for ICT AM Macros):
Line 1 Minutes: Comma-separated, e.g., "45,15" (for 09:45, 09:15).
Line 1 Color: e.g., Green (for buy-side macros).
Line 1 Style: Solid, Dashed, or Dotted (e.g., Solid for clarity).
Line 1 Width: 1–10 (e.g., 2 for thicker lines).
Line 2 Settings (e.g., for Zeussy PM Cycles):
Line 2 Minutes: e.g., "50,0,10" (for 10:50, 11:00, 11:10).
Line 2 Color: e.g., Orange (for sell-side/reversal macros).
Line 2 Style: Solid, Dashed, or Dotted (e.g., Dotted for contrast).
Line 2 Width: 1–10 (e.g., 4 for thicker lines).
Step 3: Apply in Trading
Identify Setups:
Line 1 (AM Macros): Look for Liquidity Sweeps or FVG fills around 9:45–10:15 AM. Example: On NQ futures (15-min chart), if price hits a bullish Order Block at 09:45, enter long with 1:2 RR.
Line 2 (PM Macros): Use for 90-min cycles (e.g., from 2:00 PM). Wait for MSS (Market Structure Shift) or SMT divergence for reversal trades. Exit at the next line or with a trailing stop.
Combine with ICT/Zeussy:
Use macros with FVG, OB, or BOS. Example: At 10:50 (Line 2), if price fills an FVG, trade in the direction of the bias.
X traders (e.g., @zeussy_mmxm) note: “Macros + SMT = high-probability trades.”
Risk Management:
Trade only in NY/London sessions (avoid Asia).
Limit to 1–2 trades per macro. Adjust for news (e.g., NFP increases volatility).
Example from X: “One trade a day, 9:30–11:00 AM, 51% win rate” (@I_Am_The_ICT).
Step 4: Avoid Common Issues
Lines not showing? Check chart timezone (e.g., EST/EDT), ensure hours/minutes are enabled, zoom out.
Too many lines? Reduce past_days (e.g., 2) or disable hours (max 500 lines).
No price moves? Macros are probabilistic; combine with price action (FVG, OB).
4. Benefits of the Indicator
The indicator makes ICT and Zeussy Macros accessible by visualizing key time windows, saving you from manual calculations. It focuses you on high-volatility periods, improving trade precision. X posts (e.g., @zeussy_mmxm) suggest macros boost win rates by aligning with algo signatures, reducing choppy trades and enhancing entries/exits.
5. Final Notes
Once again, I give my sincere thanks to Michael J. Huddleston for his transformative work and to Zeussy for his precise time-based strategies. I wish them both health, success, and all the best!
If you have questions, want to add alerts, or need further tweaks, let me know. Happy trading—trade smart and safe! 📈
Note: Ensure your chart is set to NY time (EST/EDT), as macros are often defined in this timezone. Today is Friday, September 12, 2025, 09:00 AM CEST—adjust the timezone if needed.
受保护脚本
此脚本以闭源形式发布。 但是,您可以自由使用,没有任何限制 — 了解更多信息这里。
免责声明
这些信息和出版物并非旨在提供,也不构成TradingView提供或认可的任何形式的财务、投资、交易或其他类型的建议或推荐。请阅读使用条款了解更多信息。
免责声明
这些信息和出版物并非旨在提供,也不构成TradingView提供或认可的任何形式的财务、投资、交易或其他类型的建议或推荐。请阅读使用条款了解更多信息。