OPEN-SOURCE SCRIPT
已更新 Pullback Scalp Trade V2
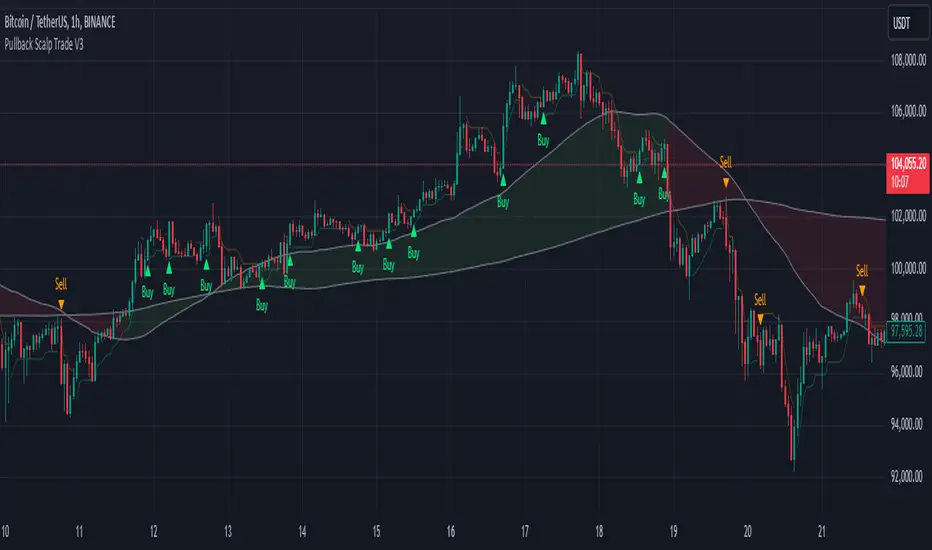
Pullback Scalp Trading Indicator
This indicator combines multiple technical analysis tools to identify potential pullback trading opportunities in trending markets. It uses a dual moving average system along with RSI for confirmation, providing a comprehensive approach to trend-following and momentum trading.
Key Features:
1. Trend Identification:
- Uses 50 and 200 period moving averages to define the overall trend
- Visual trend zone highlighting for clear market direction
- Customizable MA periods for different timeframes
2. Signal Generation System:
- Combines RSI crossovers with trend direction
- Buy signals occur when:
* Price is above 200 MA (uptrend)
* RSI crosses above its SMA
* RSI is below the lower threshold (default 50)
- Sell signals occur when:
* Price is below 200 MA (downtrend)
* RSI crosses below its SMA
* RSI is above the upper threshold (default 50)
3. Customizable Parameters:
- Short and Long MA periods
- MA types (SMA, EMA, VWMA)
- RSI length and RSI-SMA length
- RSI signal thresholds
- Trend MA periods
Usage Guidelines:
- Best used on higher timeframes (1H and above) for trend trading
- Wait for price to respect the trend zone before taking trades
- Use additional confirmation from price action or other indicators
- Adjust RSI levels based on market volatility
Limitations:
- Like all indicators, this tool may generate false signals in choppy markets
- Should not be used as a sole decision-making tool
- Past performance does not guarantee future results
----------
Türkçe Açıklama:
Bu indikatör, trendli piyasalarda potansiyel geri çekilme fırsatlarını belirlemek için birden fazla teknik analiz aracını birleştirir. Trend takibi ve momentum ticareti için kapsamlı bir yaklaşım sunan ikili hareketli ortalama sistemi ile RSI'yı bir arada kullanır.
Temel Özellikler:
1. Trend Belirleme:
- Genel trendi tanımlamak için 50 ve 200 periyotlu hareketli ortalamalar
- Görsel trend bölgesi vurgulaması
- Farklı zaman dilimleri için özelleştirilebilir MA periyotları
2. Sinyal Üretim Sistemi:
- RSI kesişimlerini trend yönü ile birleştirir
- Alış sinyalleri şu durumlarda oluşur:
* Fiyat 200 MA'nın üzerinde (yükseliş trendi)
* RSI, SMA'sını yukarı keser
* RSI alt eşiğin altında (varsayılan 50)
- Satış sinyalleri şu durumlarda oluşur:
* Fiyat 200 MA'nın altında (düşüş trendi)
* RSI, SMA'sını aşağı keser
* RSI üst eşiğin üzerinde (varsayılan 50)
3. Özelleştirilebilir Parametreler:
- Kısa ve Uzun MA periyotları
- MA tipleri (SMA, EMA, VWMA)
- RSI uzunluğu ve RSI-SMA uzunluğu
- RSI sinyal seviyeleri
- Trend MA periyotları
Kullanım Önerileri:
- Trend ticareti için yüksek zaman dilimlerinde (1S ve üzeri) kullanılması önerilir
- İşlem almadan önce fiyatın trend bölgesine saygı göstermesini bekleyin
- Fiyat hareketi veya diğer indikatörlerden ek teyit alın
- RSI seviyelerini piyasa volatilitesine göre ayarlayın
Sınırlamalar:
- Tüm indikatörler gibi, dalgalı piyasalarda yanlış sinyaller üretebilir
- Tek başına karar verme aracı olarak kullanılmamalıdır
- Geçmiş performans, gelecekteki sonuçların garantisi değildir
版本注释
How It Works- Moving Averages (MA):
The indicator calculates MA 50 and MA 200, which are customizable by the user.
Long-term trend direction is determined by whether the price is above or below MA 200.
Trend zones are visualized with green and red areas for easy identification. - Supertrend Calculation:
ATR (Average True Range) Length and Factor are user-configurable inputs.
The Supertrend indicator identifies short-term trend reversal points. - Buy and Sell Signals:Buy Signal: Triggered when the Supertrend flips from a downward signal to an upward signal, and the price is above MA 200.
Sell Signal: Triggered when the Supertrend flips from an upward signal to a downward signal, and the price is below MA 200. - Trend Color Coding:Green Zone: Indicates a positive trend (price above MA 200).
Red Zone: Indicates a negative trend (price below MA 200).
What’s New in This Version?
- Full Compatibility with Pine Script v6:
The code has been completely rewritten using Pine Script version 6.
Both the codebase and the underlying strategy have been entirely revamped, ensuring better efficiency and modern features. - User-Friendly Input Parameters:
MA 50 and MA 200 lengths can now be customized.
ATR length and the Supertrend multiplier (Factor) are fully adjustable. - Improved Visualization:
Trend zones are now more visually distinct, using intuitive green and red coloring.
Buy and sell signals are clearly displayed on the chart with corresponding text labels.
版本注释
Color adjustments have been made开源脚本
秉承TradingView的精神,该脚本的作者将其开源,以便交易者可以查看和验证其功能。向作者致敬!您可以免费使用该脚本,但请记住,重新发布代码须遵守我们的网站规则。
免责声明
这些信息和出版物并非旨在提供,也不构成TradingView提供或认可的任何形式的财务、投资、交易或其他类型的建议或推荐。请阅读使用条款了解更多信息。
开源脚本
秉承TradingView的精神,该脚本的作者将其开源,以便交易者可以查看和验证其功能。向作者致敬!您可以免费使用该脚本,但请记住,重新发布代码须遵守我们的网站规则。
免责声明
这些信息和出版物并非旨在提供,也不构成TradingView提供或认可的任何形式的财务、投资、交易或其他类型的建议或推荐。请阅读使用条款了解更多信息。