OPEN-SOURCE SCRIPT
Directional ATR
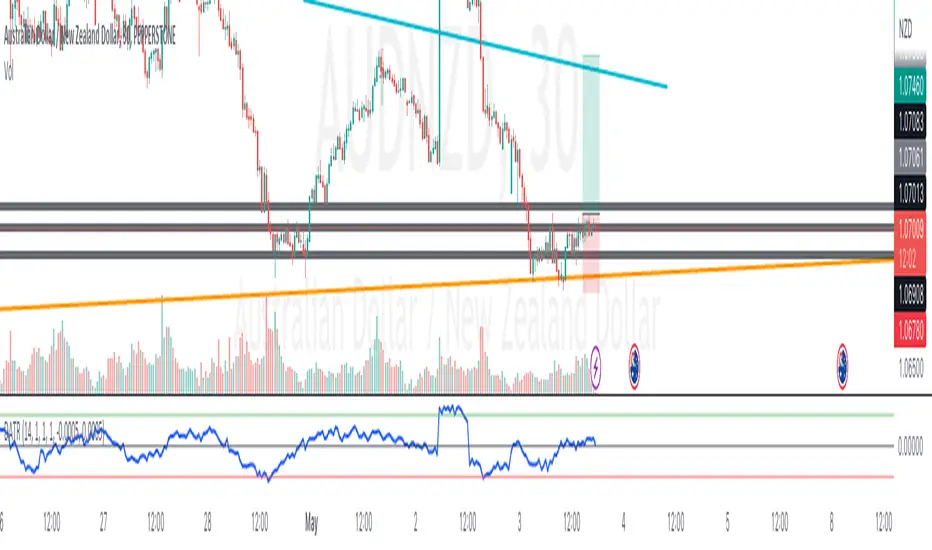
TLDR: A custom volatility indicator that combines Average True Range with candle direction.
The Directional ATR (DATR) is an indicator that enhances the traditional Average True Range (ATR) by incorporating the direction of the candle (bullish or bearish).
This indicator is designed to help traders identify trend strength, potential trend reversals, and market volatility.
Key Features:
- Trend Confirmation: Positive and increasing DATR values suggest a bullish trend, while negative and decreasing values indicate a bearish trend. A higher absolute DATR value signifies a stronger trend.
- Trend Reversal: A change in the direction of the DATR from positive to negative or vice versa may signal a potential trend reversal.
- Volatility: Like the standard ATR, the DATR can be used to gauge market volatility, with larger absolute values indicating higher volatility and smaller values suggesting lower volatility.
- Divergence: Divergence between the price and the DATR could signal a potential weakening of the trend and an upcoming reversal.
- Overbought/Oversold Levels: Extreme DATR values can be used to identify overbought or oversold market conditions, signaling potential reversals or corrections.
Please note that the Directional ATR is just an indicator, and the interpretations provided are based on its underlying logic.
It is essential to combine the DATR with other technical analysis tools and test the indicator on historical data before using it in your trading strategy. Additionally, consider other factors such as risk management, and your own trading style.
开源脚本
秉承TradingView的精神,该脚本的作者将其开源,以便交易者可以查看和验证其功能。向作者致敬!您可以免费使用该脚本,但请记住,重新发布代码须遵守我们的网站规则。
免责声明
这些信息和出版物并非旨在提供,也不构成TradingView提供或认可的任何形式的财务、投资、交易或其他类型的建议或推荐。请阅读使用条款了解更多信息。
开源脚本
秉承TradingView的精神,该脚本的作者将其开源,以便交易者可以查看和验证其功能。向作者致敬!您可以免费使用该脚本,但请记住,重新发布代码须遵守我们的网站规则。
免责声明
这些信息和出版物并非旨在提供,也不构成TradingView提供或认可的任何形式的财务、投资、交易或其他类型的建议或推荐。请阅读使用条款了解更多信息。