INVITE-ONLY SCRIPT
已更新 TradeChartist Chameleon

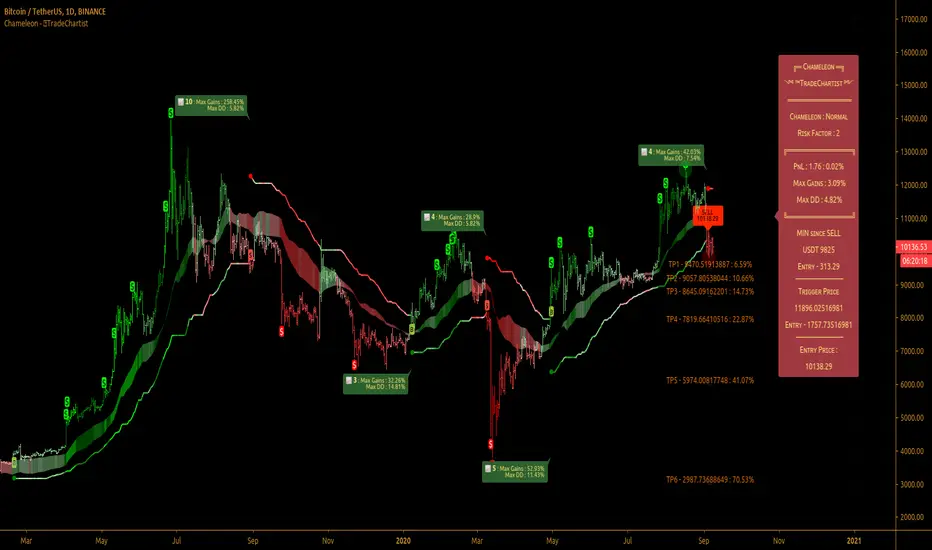
™TradeChartist Chameleon is an exceptionally beautiful trend following indicator (visualised using Chameleon plot) based on Momentum and Volatility using User input of Chameleon Mode and Risk factor (ATR multiple) to generate Trade Opportunities.
===================================================================================================================
™TradeChartist Chameleon Features
---> For Higher Timeframes, lower Risk Factor is recommended (Max - 3) as the trading range can be high based on Volatility.
---> For Lower Timeframes, higher Risk Factor can be used (Normal or Laid Back Mode) based on asset price volatility.
===================================================================================================================
How to create Alerts for ™TradeChartist Chameleon Long and Short Entries?
Alerts can be created for Long or Short entries using Once Per Bar as BUY and SELL labels appear with entries only on confirmation after bar close.
Does the indicator include Stop Loss and Take Profit plots?
This script doesn't have Stop Loss and Take Profit plots, but it can be connected to ™TradeChartist Plug and Trade as Oscillatory signal ("Chameleon") to set StopLoss and Take Profit plots and to create all types of alerts too.
Does this indicator repaint?
No. This script doesn't repaint as it confirms its signals only after close above/below Chameleon Trigger line and also uses security function to call higher time-frame values in the right way to avoid repainting. This can be verified using Bar Replay to check if the plots and fills stay in the same bar in real time as the Bar Replay.
===================================================================================================================
Best Practice: Test with different settings first using Paper Trades before trading with real money
===================================================================================================================
This is not a free to use indicator. Get in touch with me (PM me directly if you would like trial access to test the indicator)
Premium Scripts - Trial access and Information
===================================================================================================================
===================================================================================================================
™TradeChartist Chameleon Features
- Minimal user input of Chameleon Mode Selection from (Aggressive, Normal and Laid Back) and Chameleon Risk Factor (Min - 1, Max - 5 of ATR Multiple).
---> For Higher Timeframes, lower Risk Factor is recommended (Max - 3) as the trading range can be high based on Volatility.
---> For Lower Timeframes, higher Risk Factor can be used (Normal or Laid Back Mode) based on asset price volatility.
- Comprehensive Chameleon Dashboard with useful information like Real-time Gains Tracker, User settings and general trade information. Dashboard can be customised based on user preference from Chameleon Settings.
- Automatic Targets based on Trade.
- Option to paint Price Bars to help identify Price Trend.
- Option to display Profit Taking Bars (enabling this from settings will paint $ signs where Profit taking is recommended).
- Option to color background based on trade type.
- Alerts can be created for Long and Short Entry Signals using "Once per Bar" as Trade Entries are generated only upon confirmation (previous candle close below/above Chameleon Trigger line).
===================================================================================================================
How to create Alerts for ™TradeChartist Chameleon Long and Short Entries?
Alerts can be created for Long or Short entries using Once Per Bar as BUY and SELL labels appear with entries only on confirmation after bar close.
Does the indicator include Stop Loss and Take Profit plots?
This script doesn't have Stop Loss and Take Profit plots, but it can be connected to ™TradeChartist Plug and Trade as Oscillatory signal ("Chameleon") to set StopLoss and Take Profit plots and to create all types of alerts too.
Does this indicator repaint?
No. This script doesn't repaint as it confirms its signals only after close above/below Chameleon Trigger line and also uses security function to call higher time-frame values in the right way to avoid repainting. This can be verified using Bar Replay to check if the plots and fills stay in the same bar in real time as the Bar Replay.
===================================================================================================================
Best Practice: Test with different settings first using Paper Trades before trading with real money
===================================================================================================================
This is not a free to use indicator. Get in touch with me (PM me directly if you would like trial access to test the indicator)
Premium Scripts - Trial access and Information
- Trial access offered on all Premium scripts.
- PM me directly to request trial access to the scripts or for more information.
===================================================================================================================
版本注释
Code updated版本注释
Code Updated版本注释
Code Optimised仅限邀请脚本
只有作者授权的用户才能访问此脚本。您需要申请并获得使用许可。通常情况下,付款后即可获得许可。更多详情,请按照下方作者的说明操作,或直接联系TradeChartist。
TradingView不建议您付费购买或使用任何脚本,除非您完全信任其作者并了解其工作原理。您也可以在我们的社区脚本找到免费的开源替代方案。
作者的说明
Get in touch with me if you would like access to my Premium scripts for a trial before deciding on lifetime access.
Telegram - @Trade_Chartist
Free Scripts - bit.ly/Free-Scripts
Telegram - @Trade_Chartist
Free Scripts - bit.ly/Free-Scripts
免责声明
这些信息和出版物并非旨在提供,也不构成TradingView提供或认可的任何形式的财务、投资、交易或其他类型的建议或推荐。请阅读使用条款了解更多信息。
仅限邀请脚本
只有作者授权的用户才能访问此脚本。您需要申请并获得使用许可。通常情况下,付款后即可获得许可。更多详情,请按照下方作者的说明操作,或直接联系TradeChartist。
TradingView不建议您付费购买或使用任何脚本,除非您完全信任其作者并了解其工作原理。您也可以在我们的社区脚本找到免费的开源替代方案。
作者的说明
Get in touch with me if you would like access to my Premium scripts for a trial before deciding on lifetime access.
Telegram - @Trade_Chartist
Free Scripts - bit.ly/Free-Scripts
Telegram - @Trade_Chartist
Free Scripts - bit.ly/Free-Scripts
免责声明
这些信息和出版物并非旨在提供,也不构成TradingView提供或认可的任何形式的财务、投资、交易或其他类型的建议或推荐。请阅读使用条款了解更多信息。