INVITE-ONLY SCRIPT
Trader Jumblo Auto Signal V6
Trader Jumblo Auto Signal V6 is an advanced crossover-based signal system designed to generate persistent BUY and SELL entries with dynamic ATR-based Take Profit (TP) and Stop Loss (SL) levels.It provides clean, non-repainting trade signals that remain visible on the chart even after price movement — ensuring clarity during both backtesting and live trading sessions.
⚙️ How It Works
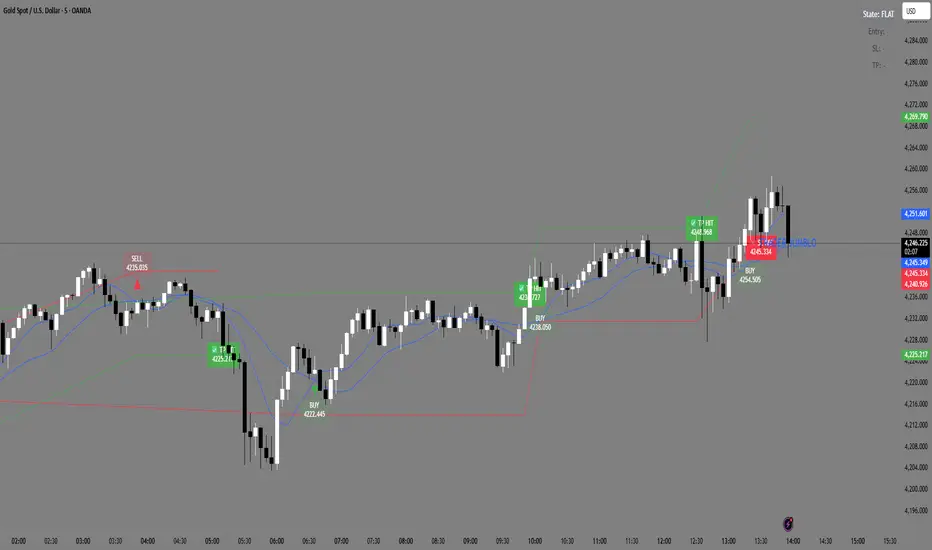
🟦 Two Blue Lines — These are your moving averages (Fast and Slow).
The crossover between them determines the signal direction.
When the Fast MA (light blue) crosses above the Slow MA → a BUY signal appears.
When the Fast MA crosses below the Slow MA → a SELL signal appears.
You can choose between SMA or EMA and adjust the lengths in the settings.
🟢 Green Line — The Take Profit (TP) level, calculated using ATR × TP multiplier.
It shows the projected target area for profit when a trade is active.
🔴 Red Line — The Stop Loss (SL) level, also based on ATR × SL multiplier.
It marks the risk boundary for each signal.
✅ When price reaches the green line, “TP HIT” appears.
❌ When price hits the red line, “SL HIT” appears.
These markers persist so you can analyze trade outcomes clearly.
📈 Main Features
Dynamic ATR-based TP and SL levels (auto-adjust with volatility)
Persistent entry, TP, and SL labels (no vanishing signals)
Optional RSI filter for signal confirmation
Instant alert system for BUY/SELL/TP/SL or combined events
Lightweight and optimized for any timeframe
⚡ Best Use
Ideal for swing and intraday traders who want visual clarity and structured risk/reward zones. Works effectively on Gold, Forex, crypto, indices, and stocks
⚙️ How It Works
🟦 Two Blue Lines — These are your moving averages (Fast and Slow).
The crossover between them determines the signal direction.
When the Fast MA (light blue) crosses above the Slow MA → a BUY signal appears.
When the Fast MA crosses below the Slow MA → a SELL signal appears.
You can choose between SMA or EMA and adjust the lengths in the settings.
🟢 Green Line — The Take Profit (TP) level, calculated using ATR × TP multiplier.
It shows the projected target area for profit when a trade is active.
🔴 Red Line — The Stop Loss (SL) level, also based on ATR × SL multiplier.
It marks the risk boundary for each signal.
✅ When price reaches the green line, “TP HIT” appears.
❌ When price hits the red line, “SL HIT” appears.
These markers persist so you can analyze trade outcomes clearly.
📈 Main Features
Dynamic ATR-based TP and SL levels (auto-adjust with volatility)
Persistent entry, TP, and SL labels (no vanishing signals)
Optional RSI filter for signal confirmation
Instant alert system for BUY/SELL/TP/SL or combined events
Lightweight and optimized for any timeframe
⚡ Best Use
Ideal for swing and intraday traders who want visual clarity and structured risk/reward zones. Works effectively on Gold, Forex, crypto, indices, and stocks
仅限邀请脚本
只有作者授权的用户才能访问此脚本。您需要申请并获得使用许可。通常情况下,付款后即可获得许可。更多详情,请按照下方作者的说明操作,或直接联系TraderJumblo。
TradingView不建议您付费购买或使用任何脚本,除非您完全信任其作者并了解其工作原理。您也可以在我们的社区脚本找到免费的开源替代方案。
作者的说明
✅ Author’s Instructions (short version)
Add to chart → choose SMA or EMA → optional RSI filter.
BUY/SELL signals show with ATR-based TP (green) & SL (red).
Labels appear exactly where TP/SL is hit.
Watermark follows live price.
Use alerts for BUY/
免责声明
这些信息和出版物并非旨在提供,也不构成TradingView提供或认可的任何形式的财务、投资、交易或其他类型的建议或推荐。请阅读使用条款了解更多信息。