OPEN-SOURCE SCRIPT
已更新 Composite Index [TipsChain]
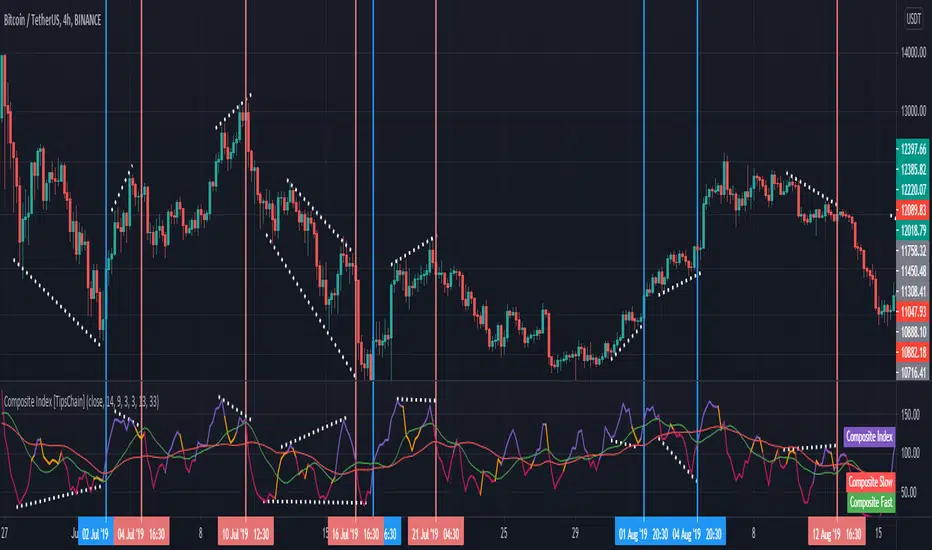
This is a formula Ms Brown developed to identify divergence failures with in the RSI . This also highlights the horizontal support levels with in the indicator area.
The Composite Index study comprises 2 momentum indicators on the RSI which are smoothed using a moving average. Control of the upper and lower indicators can be used to adjust the periods represented by each through the Object Properties dialog box for the study.
The Composite Index is an oscillator that will warn when the RSI is failing to detect a price trend reversal by forming divergences with the RSI. It can be used in any time frame or market.
Usage:
1. Check hidden and regular divergences on RSI+COMPOSITE_INDEX and PRICE+COMPOSITE_INDEX.
2. After finding divergence wait for COMPOSITE_INDEX to cross under/over it's moving averages to trigger.
版本注释
Recreate the indicator according to Ms. Brown's book "Technical analysis for the trading professional"The formula of this indicator on page 369 of this book is as follows:
Step 1: create a 9-period momentum indicator of 14-period RSI. Yes, it is momentum on RSI , not price. This is an indicator on an indicator.
Step 2: create a very short3-period RSI and then a simple 3-period moving average of the 3-period RSI to smooth is Slightly.
Step 3: add Step 1 and 2 together to create the Composite Index.
Step 4: create two simple moving averages of the Composite Index using the period 13 and 33.
Step 5: plot the composite Index and its two simple averages as three lines in a separate frame under the price data.
开源脚本
秉承TradingView的精神,该脚本的作者将其开源,以便交易者可以查看和验证其功能。向作者致敬!您可以免费使用该脚本,但请记住,重新发布代码须遵守我们的网站规则。
免责声明
这些信息和出版物并非旨在提供,也不构成TradingView提供或认可的任何形式的财务、投资、交易或其他类型的建议或推荐。请阅读使用条款了解更多信息。
免责声明
这些信息和出版物并非旨在提供,也不构成TradingView提供或认可的任何形式的财务、投资、交易或其他类型的建议或推荐。请阅读使用条款了解更多信息。