OPEN-SOURCE SCRIPT
已更新 Visual Range Position Size Calculator
Visual Range Position Size Calculator
The "VR Position Size Calculator" helps traders determine the appropriate position size based on their risk tolerance and the current market conditions. Below is a detailed description of the script, its functionality, and how to use it effectively.
---
Key Features
1. Risk Calculation: The script allows users to input their desired risk in monetary terms (in the currency of the ticker). It then calculates the position sizes for both long and short trades based on this risk.
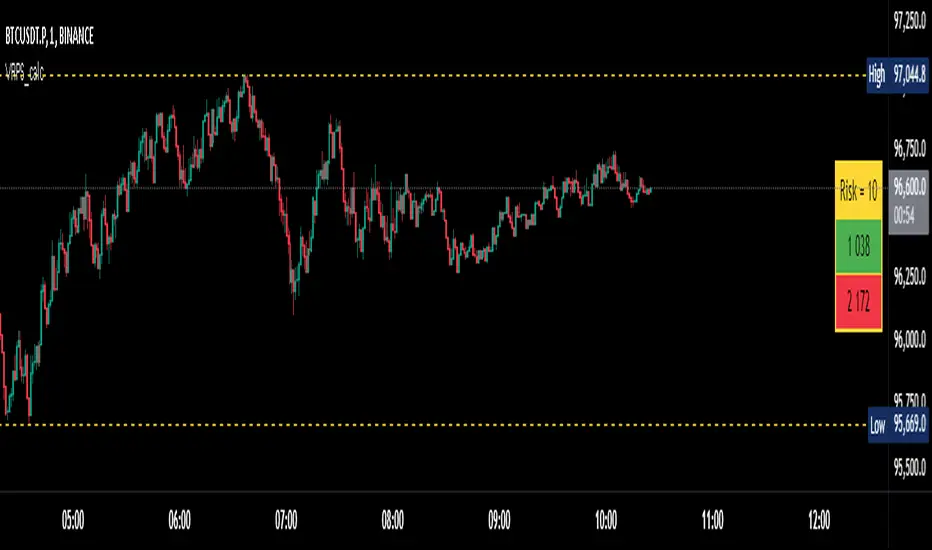
2. Dynamic High and Low Tracking: The script dynamically tracks the highest and lowest prices within the visible range of the chart, allowing for more accurate position sizing.
3. Formatted Output: The calculated values are displayed in a user-friendly table format with thousands separators for better readability.
4. Visual Indicators: Dashed lines are drawn on the chart at the high and low points of the visible range, providing a clear visual reference for traders.
5. If the risk in security price is 1% or less, the background of the cells displaying position sizes will be green for long positions and red for short positions. If the risk is between 1% and 5%, the background changes to gray, indicating that the risk may be too high for an effective trade. If the risk exceeds 5% of the price, the text also turns gray, rendering it invisible, which signifies that there is no justification for such a trade.
---
Code Explanation
The script identifies the start and end times of the visible range on the chart, ensuring calculations are based only on the data currently in view. It updates and stores the highest (hh) and lowest (ll) prices within this visible range. At the end of the range, dashed lines are drawn at the high and low prices, providing a visual cue for traders.
Users can input their risk amount, which is then used to calculate potential position sizes for both long and short trades based on the current price relative to the tracked high and low. The calculated risk values and position sizes are displayed in a table on the right side of the chart, with color coding to indicate whether the calculated position size meets specific criteria.
---
Usage Instructions
1. Add the Indicator: To use this script, copy and paste it into Pine Script editor, then add it to your chart.
2. Input Your Risk: Adjust the 'Risk in money' input to reflect your desired risk amount for trading.
3. Analyze Position Sizes: Observe the calculated position sizes for both long and short trades displayed in the table. Use this information to guide your trading decisions.
4. Visual Cues: Utilize the dashed lines on the chart to understand recent price extremes within your visible range.
The "VR Position Size Calculator" helps traders determine the appropriate position size based on their risk tolerance and the current market conditions. Below is a detailed description of the script, its functionality, and how to use it effectively.
---
Key Features
1. Risk Calculation: The script allows users to input their desired risk in monetary terms (in the currency of the ticker). It then calculates the position sizes for both long and short trades based on this risk.
2. Dynamic High and Low Tracking: The script dynamically tracks the highest and lowest prices within the visible range of the chart, allowing for more accurate position sizing.
3. Formatted Output: The calculated values are displayed in a user-friendly table format with thousands separators for better readability.
4. Visual Indicators: Dashed lines are drawn on the chart at the high and low points of the visible range, providing a clear visual reference for traders.
5. If the risk in security price is 1% or less, the background of the cells displaying position sizes will be green for long positions and red for short positions. If the risk is between 1% and 5%, the background changes to gray, indicating that the risk may be too high for an effective trade. If the risk exceeds 5% of the price, the text also turns gray, rendering it invisible, which signifies that there is no justification for such a trade.
---
Code Explanation
The script identifies the start and end times of the visible range on the chart, ensuring calculations are based only on the data currently in view. It updates and stores the highest (hh) and lowest (ll) prices within this visible range. At the end of the range, dashed lines are drawn at the high and low prices, providing a visual cue for traders.
Users can input their risk amount, which is then used to calculate potential position sizes for both long and short trades based on the current price relative to the tracked high and low. The calculated risk values and position sizes are displayed in a table on the right side of the chart, with color coding to indicate whether the calculated position size meets specific criteria.
---
Usage Instructions
1. Add the Indicator: To use this script, copy and paste it into Pine Script editor, then add it to your chart.
2. Input Your Risk: Adjust the 'Risk in money' input to reflect your desired risk amount for trading.
3. Analyze Position Sizes: Observe the calculated position sizes for both long and short trades displayed in the table. Use this information to guide your trading decisions.
4. Visual Cues: Utilize the dashed lines on the chart to understand recent price extremes within your visible range.
版本注释
Script name changed...版本注释
- name, short name edited- color preferences customization added
- risk tolerance levels settings adjustment added
版本注释
- the option to change table position on screen has been added开源脚本
秉承TradingView的精神,该脚本的作者将其开源,以便交易者可以查看和验证其功能。向作者致敬!您可以免费使用该脚本,但请记住,重新发布代码须遵守我们的网站规则。
免责声明
这些信息和出版物并非旨在提供,也不构成TradingView提供或认可的任何形式的财务、投资、交易或其他类型的建议或推荐。请阅读使用条款了解更多信息。
免责声明
这些信息和出版物并非旨在提供,也不构成TradingView提供或认可的任何形式的财务、投资、交易或其他类型的建议或推荐。请阅读使用条款了解更多信息。