PROTECTED SOURCE SCRIPT
已更新 Sangana beta table
Ideal to use this indicator in Monthly timeframe.
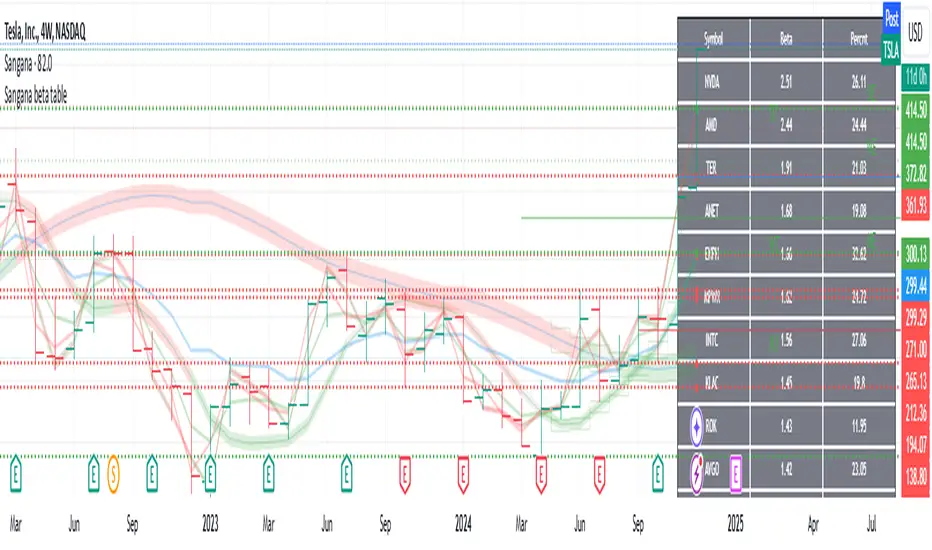
This indicator shows three values on a table.
First column is stocks list from a particular sector(sector selection from settings)
Second column is beta of stock. Beta can be used to check how correlated(multiplied by how volatile) the stock is with respect to market S&P500 or Nifty500.
Third column is average percentage of a stock price movement in a month from low price to high price. This is just calculated on the price. If one enters at the low of that monthly candle and exits at the high of that monthly candle, they can expect to gain that much percentage on an average that is shown in this column.
How to use this indicator: Bigger returns on a stock is expected if it swings good amount of percentage from low to high on a regular basis. Either short term or long term, investing in the stocks which high average percentage from low to high, yields better returns. However downside also gives bigger losses if stock is going down. Stay in high volatile stocks, if one is sure of upside movement.
Sorting of beta column or percentage column can be chosen on settings. Sorting is always down high to low.
This indicator is tracks stocks in S&P500 or Nifty500.
版本注释
Minor bug fix for beta calculation with respect to SPY.受保护脚本
此脚本以闭源形式发布。 但是,您可以自由使用,没有任何限制 — 了解更多信息这里。
免责声明
这些信息和出版物并非旨在提供,也不构成TradingView提供或认可的任何形式的财务、投资、交易或其他类型的建议或推荐。请阅读使用条款了解更多信息。
受保护脚本
此脚本以闭源形式发布。 但是,您可以自由使用,没有任何限制 — 了解更多信息这里。
免责声明
这些信息和出版物并非旨在提供,也不构成TradingView提供或认可的任何形式的财务、投资、交易或其他类型的建议或推荐。请阅读使用条款了解更多信息。