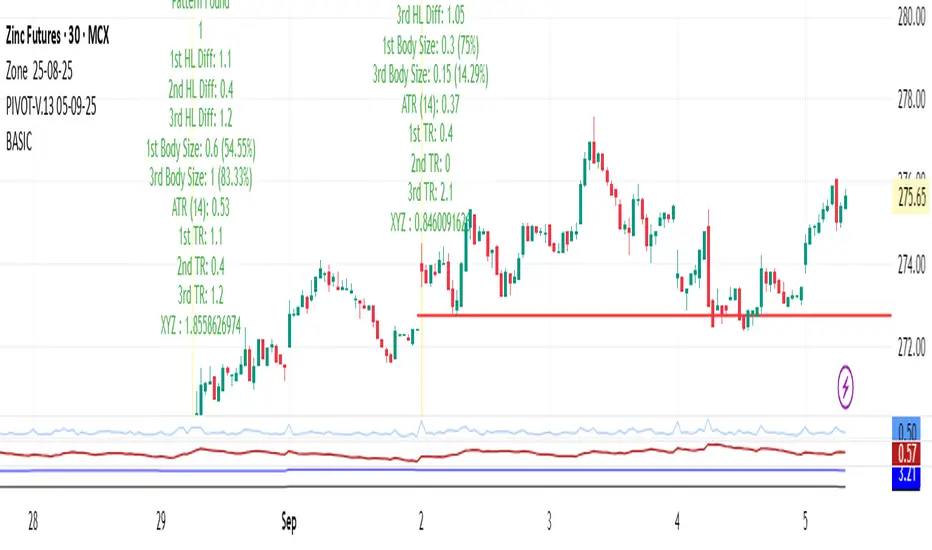
INVITE-ONLY SCRIPT
BASIC

You want a clear explanation of chart patterns (the shapes/structures price makes on charts) that traders use to identify possible future price movements. Let me break them down into two big groups:
---
📊 1. Continuation Patterns
👉 These suggest that the current trend (uptrend or downtrend) will likely continue.
🔹 Flag
Bull Flag → Appears in an uptrend. Sharp upward move (flagpole) followed by a small downward/sideways channel (the flag).
Bear Flag → Opposite, in a downtrend.
📌 Meaning: After the flag consolidation, price usually continues in the original direction.
---
🔹 Pennant
Small symmetrical triangle after a strong move.
Shows temporary pause before trend continuation.
📌 Meaning: Breakout usually follows in the direction of the main trend.
---
🔹 Rectangle
Price moves between parallel support & resistance levels.
Breakout usually happens in the direction of the prevailing trend.
---
📊 2. Reversal Patterns
👉 These suggest that the current trend may reverse direction.
🔹 Head & Shoulders
Looks like a head with two shoulders.
Head & Shoulders Top → Reversal from uptrend to downtrend.
Inverse Head & Shoulders → Reversal from downtrend to uptrend.
📌 Key Level: The “neckline” → breakout confirms reversal.
---
🔹 Double Top & Double Bottom
Double Top → Price tests resistance twice but fails, bearish reversal.
Double Bottom → Price tests support twice but fails, bullish reversal.
---
🔹 Triple Top & Triple Bottom
Same as double but with three tests. Stronger reversal signal.
---
🔹 Rounding Bottom (Saucer)
Price gradually shifts from downtrend to uptrend, looks like a "U" shape.
Very reliable for long-term reversals.
---
📊 3. Neutral / Indecision Patterns
👉 These show uncertainty – direction is confirmed only after breakout.
🔹 Symmetrical Triangle
Price makes lower highs & higher lows (converging).
Breakout can happen either side.
🔹 Ascending Triangle
Flat resistance at top, higher lows forming.
Usually bullish breakout.
🔹 Descending Triangle
Flat support at bottom, lower highs forming.
Usually bearish breakout.
---
✅ Summary for traders:
Continuation = Flag, Pennant, Rectangle.
Reversal = Head & Shoulders, Double/Triple Tops & Bottoms, Rounding Bottom.
Neutral/Indecision = Triangles.
---
Would you like me to make a visual chart image with all these patterns drawn, so you can see how they look on real candlesticks?
---
📊 1. Continuation Patterns
👉 These suggest that the current trend (uptrend or downtrend) will likely continue.
🔹 Flag
Bull Flag → Appears in an uptrend. Sharp upward move (flagpole) followed by a small downward/sideways channel (the flag).
Bear Flag → Opposite, in a downtrend.
📌 Meaning: After the flag consolidation, price usually continues in the original direction.
---
🔹 Pennant
Small symmetrical triangle after a strong move.
Shows temporary pause before trend continuation.
📌 Meaning: Breakout usually follows in the direction of the main trend.
---
🔹 Rectangle
Price moves between parallel support & resistance levels.
Breakout usually happens in the direction of the prevailing trend.
---
📊 2. Reversal Patterns
👉 These suggest that the current trend may reverse direction.
🔹 Head & Shoulders
Looks like a head with two shoulders.
Head & Shoulders Top → Reversal from uptrend to downtrend.
Inverse Head & Shoulders → Reversal from downtrend to uptrend.
📌 Key Level: The “neckline” → breakout confirms reversal.
---
🔹 Double Top & Double Bottom
Double Top → Price tests resistance twice but fails, bearish reversal.
Double Bottom → Price tests support twice but fails, bullish reversal.
---
🔹 Triple Top & Triple Bottom
Same as double but with three tests. Stronger reversal signal.
---
🔹 Rounding Bottom (Saucer)
Price gradually shifts from downtrend to uptrend, looks like a "U" shape.
Very reliable for long-term reversals.
---
📊 3. Neutral / Indecision Patterns
👉 These show uncertainty – direction is confirmed only after breakout.
🔹 Symmetrical Triangle
Price makes lower highs & higher lows (converging).
Breakout can happen either side.
🔹 Ascending Triangle
Flat resistance at top, higher lows forming.
Usually bullish breakout.
🔹 Descending Triangle
Flat support at bottom, lower highs forming.
Usually bearish breakout.
---
✅ Summary for traders:
Continuation = Flag, Pennant, Rectangle.
Reversal = Head & Shoulders, Double/Triple Tops & Bottoms, Rounding Bottom.
Neutral/Indecision = Triangles.
---
Would you like me to make a visual chart image with all these patterns drawn, so you can see how they look on real candlesticks?
仅限邀请脚本
只有经作者批准的用户才能访问此脚本。您需要申请并获得使用权限。该权限通常在付款后授予。如需了解更多详情,请按照以下作者的说明操作,或直接联系jatingajjar75。
除非您完全信任其作者并了解脚本的工作原理,否則TradingView不建议您付费或使用脚本。您还可以在我们的社区脚本中找到免费的开源替代方案。
作者的说明
The provided text indicates that the script in question is an "invite-only" script, likely on a platform like TradingView, and access is restricted to users authorized by the author, john joshi@gmail.com, This typically involves a payment and requires dir
免责声明
这些信息和出版物并不意味着也不构成TradingView提供或认可的金融、投资、交易或其它类型的建议或背书。请在使用条款阅读更多信息。