OPEN-SOURCE SCRIPT
ACD PMA
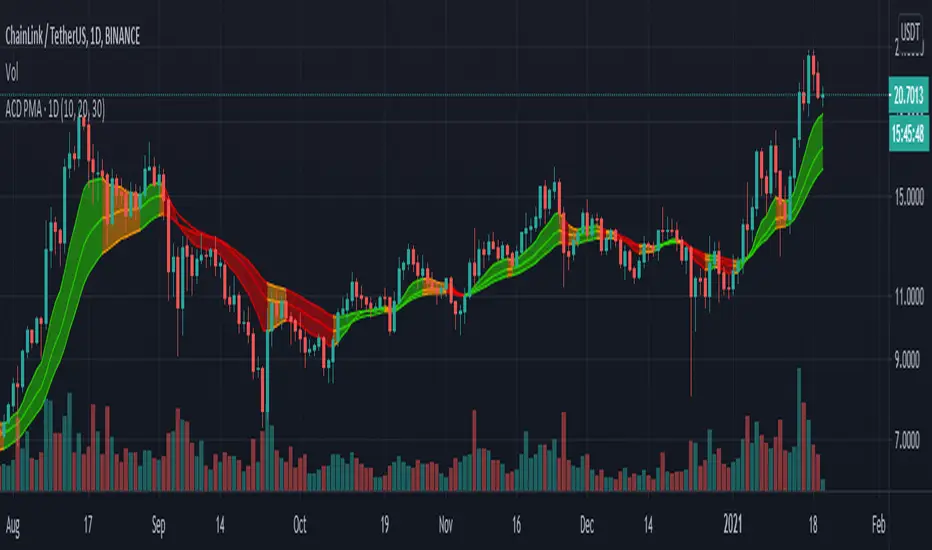
PMA (Pivot Moving average) is a set of 3 EMAs on HLC3 data.
When all PMAs are rising, market is considered bullish and the color of PMA becomes green. When all PMAs are falling, market is considered bearish and the color of the PMA becomes red. Otherwise, market is considered ranging and the color becomes orange.
It's also possible to set the resolution of PMAs. For example, you can see daily PMA of 15min charts. This way, if resolution of PMA is greater than resolution of chart, a vertical line shows the beginning of the PMA's resolution candles.
These PMAs are important components of Mark Fisher's ACD strategy.
开源脚本
秉承TradingView的精神,该脚本的作者将其开源,以便交易者可以查看和验证其功能。向作者致敬!您可以免费使用该脚本,但请记住,重新发布代码须遵守我们的网站规则。
免责声明
这些信息和出版物并非旨在提供,也不构成TradingView提供或认可的任何形式的财务、投资、交易或其他类型的建议或推荐。请阅读使用条款了解更多信息。
免责声明
这些信息和出版物并非旨在提供,也不构成TradingView提供或认可的任何形式的财务、投资、交易或其他类型的建议或推荐。请阅读使用条款了解更多信息。