OPEN-SOURCE SCRIPT
已更新 Multi‑Timeframe RSIOMA Dashboard
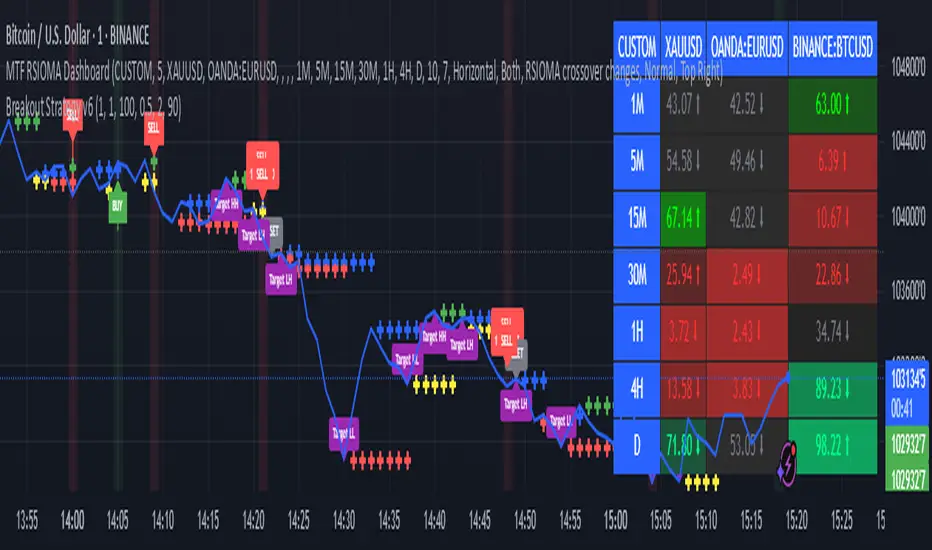
The Multi-Timeframe RSIOMA Dashboard is a TradingView tool that displays RSIOMA (Relative Strength Index Over Moving Average) values for up to 10 symbols across multiple timeframes in a color-coded table. It helps traders spot bullish (>50, green) or bearish (<50, red) momentum, with optional MA smoothing for clearer trends. Customize symbols, timeframes, and settings to track market strength at a glanc
版本注释
UPDATE 版本注释
UPDATE版本注释
UPDATE版本注释
update 版本注释
update版本注释
UPDATE版本注释
update版本注释
UPDATE版本注释
update 版本注释
UPDATE 开源脚本
秉承TradingView的精神,该脚本的作者将其开源,以便交易者可以查看和验证其功能。向作者致敬!您可以免费使用该脚本,但请记住,重新发布代码须遵守我们的网站规则。
免责声明
这些信息和出版物并非旨在提供,也不构成TradingView提供或认可的任何形式的财务、投资、交易或其他类型的建议或推荐。请阅读使用条款了解更多信息。
开源脚本
秉承TradingView的精神,该脚本的作者将其开源,以便交易者可以查看和验证其功能。向作者致敬!您可以免费使用该脚本,但请记住,重新发布代码须遵守我们的网站规则。
免责声明
这些信息和出版物并非旨在提供,也不构成TradingView提供或认可的任何形式的财务、投资、交易或其他类型的建议或推荐。请阅读使用条款了解更多信息。