PROTECTED SOURCE SCRIPT
已更新 Doji Candle with Horizontal Lines Raja Saien
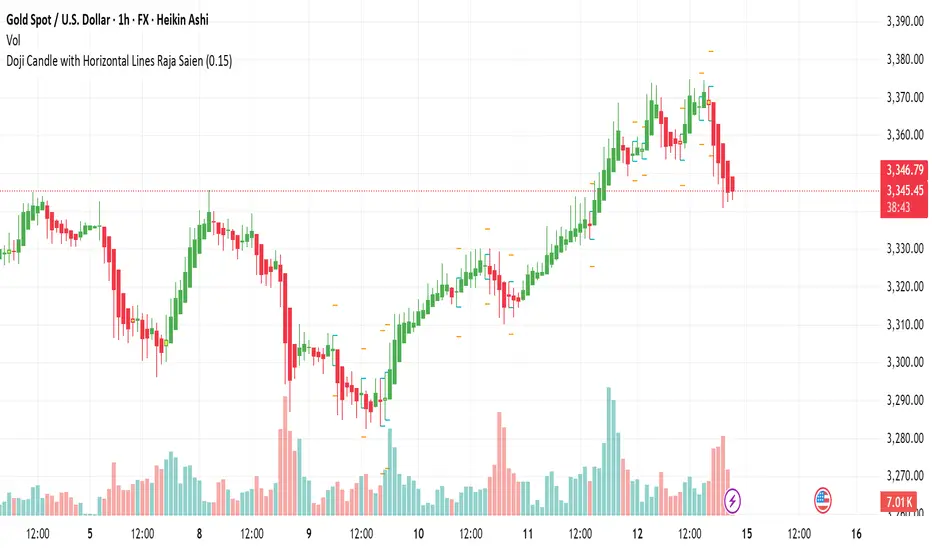
🔰 Doji Candle with Horizontal Lines By Raja Saien
Created by: Wasif Samejo
Script Type: Visual Doji Identifier with Key Level Markers
Overlay: Yes
📌 Description:
This indicator helps you visually identify Doji candles and automatically plots horizontal key levels based on their high, low, and a defined price zone.
A Doji candle is a powerful signal in price action trading that shows indecision in the market, often leading to strong reversals or breakouts. This script is especially useful for traders who want to mark such candles and prepare for possible trade setups.
📈 Features:
✅ Automatic Doji Detection – Based on customizable body size (20.0% of the total range).
✅ Highlights Doji Candle – Visually changes the bar color to yellow when a Doji is found.
✅ High/Low Horizontal Lines – Marks the candle's actual high and low for better visual analysis.
✅ Zone Lines Above/Below – Draws outer levels to form a zone around the Doji, helpful for breakout setups.
Zone Line Color – Set the color for the upper and lower zone lines.
High/Low Line Color – Set the color for the high and low candle levels.
💡 Combine this indicator with trendlines, volume, or Fibonacci tools for better confirmation.
版本注释
"Doji Candle with Horizontal Lines by Raja Saien" is a powerful visual tool that helps traders easily spot Doji candles — key signs of market indecision or potential reversal.🔍 Key Features:
Automatically detects Doji candles based on customizable body size (% of total candle range).
Draws horizontal lines at the candle's High and Low.
Adds outer zone lines above the high and below the low for extended visualization.
Highlights Doji candles on the chart with a yellow bar.
Built-in alert system notifies you instantly when a Doji candle forms.
🚨 Alert:
When a valid Doji candle appears, you’ll receive an alert titled:
“Doji Candle Alert – Doji Candle formed!”
🧠 How It Helps:
Doji candles often indicate indecision between buyers and sellers and can serve as key turning points in the market. This indicator helps you catch these moments visually and through real-time alerts — no need to manually scan the chart.
受保护脚本
此脚本以闭源形式发布。 但是,您可以自由使用,没有任何限制 — 了解更多信息这里。
免责声明
这些信息和出版物并非旨在提供,也不构成TradingView提供或认可的任何形式的财务、投资、交易或其他类型的建议或推荐。请阅读使用条款了解更多信息。
免责声明
这些信息和出版物并非旨在提供,也不构成TradingView提供或认可的任何形式的财务、投资、交易或其他类型的建议或推荐。请阅读使用条款了解更多信息。