PROTECTED SOURCE SCRIPT
VCCB Stocks - Volume Coloured Candle Bars
VCCB Volume Coloured Candle Bars (for Stocks, Indices, ETF, Commodities)
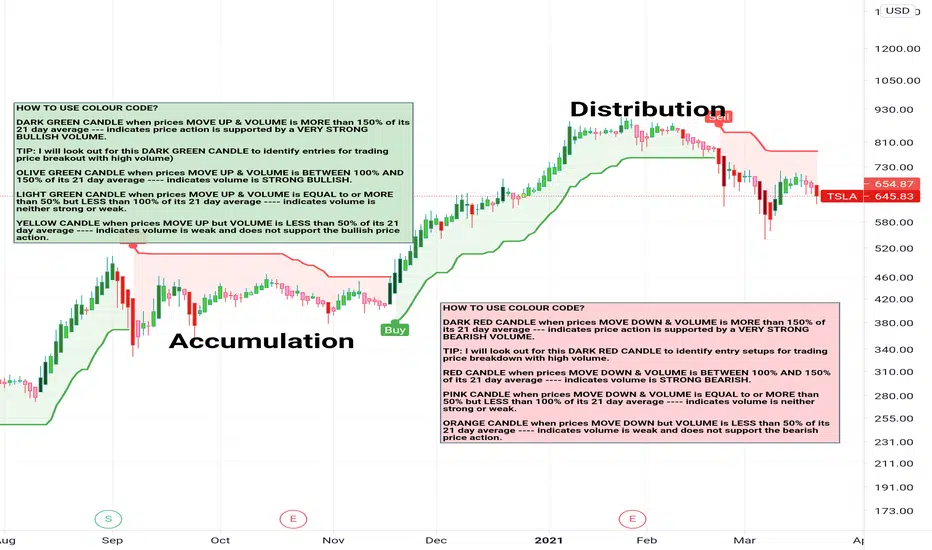
This indicator colour-codes the candlesticks to help traders easily identify if price action is supported by STRONG BULLISH -or- BEARISH VOLUME.
.
.
DARK GREEN CANDLE when prices MOVE UP & VOLUME is MORE than 150% of its 21 day average --- indicates price action is supported by a VERY STRONG BULLISH VOLUME.
TIP: I will look out for this DARK GREEN CANDLE to identify entries for trading price breakout with high volume)
OLIVE GREEN CANDLE when prices MOVE UP & VOLUME is BETWEEN 100% AND 150% of its 21 day average ---- indicates volume is STRONG BULLISH.
LIGHT GREEN CANDLE when prices MOVE UP & VOLUME is EQUAL to or MORE than 50% but LESS than 100% of its 21 day average ---- indicates volume is neither strong or weak.
YELLOW CANDLE when prices MOVE UP but VOLUME is LESS than 50% of its 21 day average ---- indicates volume is weak and does not support the bullish price action.
.
.
DARK RED CANDLE when prices MOVE DOWN & VOLUME is MORE than 150% of its 21 day average --- indicates price action is supported by a VERY STRONG BEARISH VOLUME.
TIP: I will look out for this DARK RED CANDLE to identify entry setups for trading price breakdown with high volume.
RED CANDLE when prices MOVE DOWN & VOLUME is BETWEEN 100% AND 150% of its 21 day average ---- indicates volume is STRONG BEARISH.
PINK CANDLE when prices MOVE DOWN & VOLUME is EQUAL to or MORE than 50% but LESS than 100% of its 21 day average ---- indicates volume is neither strong or weak.
ORANGE CANDLE when prices MOVE DOWN but VOLUME is LESS than 50% of its 21 day average ---- indicates volume is weak and does not support the bearish price action.
.
.
I recommend using this indicator in conjuction with Supertrend Indicator (that provides dynamic levels of support and resistance) to help you identify potential entry/exit points.
受保护脚本
此脚本以闭源形式发布。 但是,您可以自由使用它,没有任何限制 — 在此处了解更多信息。
💡Market Trends, Investment Cycles, Trade Ideas & Concept Setups using 𝐕𝐂𝐂𝐁 𝐏𝐎𝐖𝐄𝐑 𝐓𝐑𝐄𝐍𝐃 𝐒𝐘𝐒𝐓𝐄𝐌 (𝐏𝐓𝐒).
✪ x.com/petersinguili
✪ x.com/VCCBtrader
✪ Telegram Broadcast: t.me/VCCBtrader
✪ x.com/petersinguili
✪ x.com/VCCBtrader
✪ Telegram Broadcast: t.me/VCCBtrader
免责声明
这些信息和出版物并不意味着也不构成TradingView提供或认可的金融、投资、交易或其它类型的建议或背书。请在使用条款阅读更多信息。