OPEN-SOURCE SCRIPT
COT | MERCOR
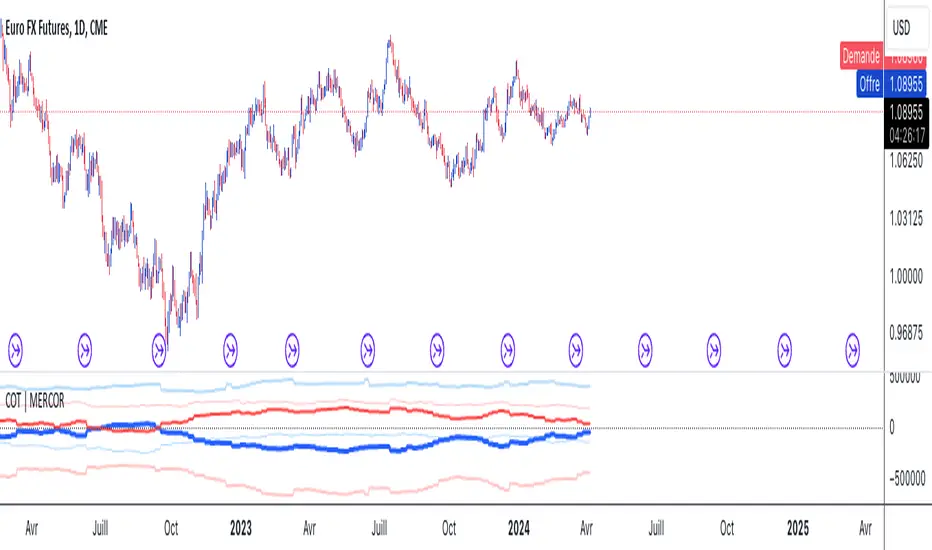
This Pine Script is designed for use on the TradingView platform to visualize various Commitment of Traders (COT) data for trading analysis. The COT reports provide a breakdown of each Tuesday’s open interest in the futures markets, which is valuable for understanding market sentiment. This script specifically focuses on displaying the positions of commercial and noncommercial traders (large speculators), both in long and short positions, as well as their net positions. Here’s a breakdown of the script’s components and how to use it:
Script Components
Indicator Declaration: The script begins by declaring a custom indicator using indicator() function, naming it "COT | MERCOR", and setting a short title and precision.
Library Import: It imports a library TradingView/LibraryCOT/2 as cot, which is likely a mock representation for the purpose of this description, assuming a library that provides COT data functions.
User Inputs:
shortNegative: A boolean input that allows users to choose whether short positions are displayed as negative numbers.
invertColors: A boolean input for users to decide if they want to invert the default colors of the plot lines.
lineWidth: An integer input that lets users adjust the width of the plotted lines.
COT Data Requests: The script requests COT data for both commercial and noncommercial traders' long and short positions using cot.COTTickerid() function. This includes constructing identifiers for these data points based on the user's input and predefined criteria (like "Commercial Positions" or "Noncommercial Positions", and direction "Long" or "Short").
Data Plotting: The script plots the retrieved data points on the chart, using different colors and line styles to distinguish between commercial and noncommercial positions, as well as between long, short, and net positions. It includes options to adjust the appearance based on user inputs (like inverting colors or changing line width).
Zero Line: A horizontal line (hline) is plotted at zero to provide a baseline for comparison.
How to Use
Adding the Script to Your Chart:
On TradingView, open the Pine Editor.
Paste this script into the Pine Editor.
Save and add the script to your chart.
Customizing the Display:
You can toggle whether short positions are displayed as negative numbers through the "Show Shorts as Negative Numbers?" checkbox.
Use the "Invert Colors?" checkbox to swap the colors used for plotting the positions.
Adjust the "Line Width" option to change the thickness of the plotted lines according to your preference.
Analyzing the Data:
The plotted lines represent the long, short, and net positions of commercial and noncommercial traders.
Commercial positions are typically considered the positions of entities involved in the production, processing, or merchandising of a commodity, whereas noncommercial positions represent large speculators, such as hedge funds.
The net positions (long minus short) provide insight into the overall bullish or bearish sentiment among these trader categories.
By examining these positions, traders can gain insights into potential market moves based on the behaviors of key market participants.
This script is a powerful tool for traders who want to incorporate COT report data into their market analysis on TradingView. By visualizing the trading positions of significant market players, it aids in making informed trading decisions.
开源脚本
秉承TradingView的精神,该脚本的作者将其开源,以便交易者可以查看和验证其功能。向作者致敬!您可以免费使用该脚本,但请记住,重新发布代码须遵守我们的网站规则。
免责声明
这些信息和出版物并非旨在提供,也不构成TradingView提供或认可的任何形式的财务、投资、交易或其他类型的建议或推荐。请阅读使用条款了解更多信息。
免责声明
这些信息和出版物并非旨在提供,也不构成TradingView提供或认可的任何形式的财务、投资、交易或其他类型的建议或推荐。请阅读使用条款了解更多信息。