OPEN-SOURCE SCRIPT
Correlation Analysis Tool
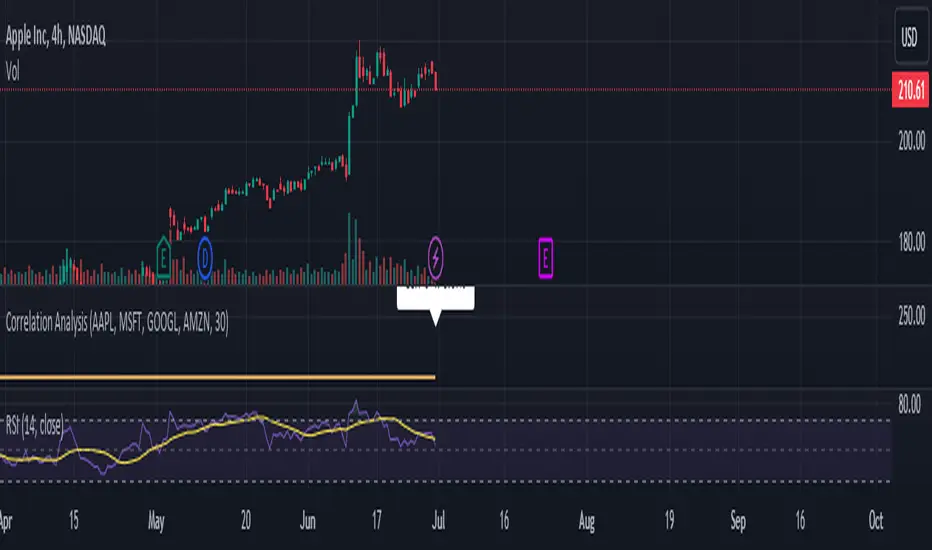
📈 What Does It Do?
🔍 How It Works
⚙️ Features
🧩 How to Use
🚨 Limitations
💡 Best Ways To Use
📜 Disclaimer
This script is for educational and informational purposes only. Please conduct your own research and consult with a financial advisor before making investment decisions. The author is not responsible for any losses or damages resulting from the use of this script.
- Correlation Calculation: Measures the correlation between a selected asset (Asset 1) and up to four additional assets (Asset 2, Asset 3, Asset 4, Asset 5).
- User Inputs: Allows you to define the primary asset and up to four comparison assets, as well as the period for correlation calculations.
- Correlation Matrix: Displays a matrix of correlation coefficients as a text label on the chart.
🔍 How It Works
- Inputs: Enter the symbols for Asset 1 (main asset) and up to four other assets for comparison.
- Correlation Period: Specify the period over which the correlations are calculated.
- Calculations: Computes log returns for each asset and calculates the correlation coefficients.
- Display: Shows a textual correlation matrix at the top of the chart with percentage values.
⚙️ Features
- Customizable Assets: Input symbols for one primary asset and up to four other assets.
- Flexible Period: Choose the period for correlation calculation.
- Correlation Coefficients: Outputs correlation values for all asset pairs.
- Textual Correlation Matrix: Provides a correlation matrix with percentage values for quick reference.
🧩 How to Use
- Add the Script: Apply the script to any asset’s chart.
- Set Asset Symbols: Enter the symbols for Asset 1 and up to four other assets.
- Adjust Correlation Period: Define the period for which correlations are calculated.
- Review Results: Check the correlation matrix displayed on the chart for insights.
🚨 Limitations
- Historical Data Dependency: Correlations are based on historical data and might not reflect future market conditions.
- No Visual Plots Yet: This script does not include visual plots; it only provides a textual correlation matrix.
💡 Best Ways To Use
- Sector Comparison: Compare assets within the same sector or industry for trend analysis.
- Diversification Analysis: Use the correlations to understand how different assets might diversify or overlap in your portfolio.
- Strategic Decision Making: Utilize correlation data for making informed investment decisions and portfolio adjustments.
📜 Disclaimer
This script is for educational and informational purposes only. Please conduct your own research and consult with a financial advisor before making investment decisions. The author is not responsible for any losses or damages resulting from the use of this script.
开源脚本
秉承TradingView的精神,该脚本的作者将其开源,以便交易者可以查看和验证其功能。向作者致敬!您可以免费使用该脚本,但请记住,重新发布代码须遵守我们的网站规则。
免责声明
这些信息和出版物并非旨在提供,也不构成TradingView提供或认可的任何形式的财务、投资、交易或其他类型的建议或推荐。请阅读使用条款了解更多信息。
开源脚本
秉承TradingView的精神,该脚本的作者将其开源,以便交易者可以查看和验证其功能。向作者致敬!您可以免费使用该脚本,但请记住,重新发布代码须遵守我们的网站规则。
免责声明
这些信息和出版物并非旨在提供,也不构成TradingView提供或认可的任何形式的财务、投资、交易或其他类型的建议或推荐。请阅读使用条款了解更多信息。