INVITE-ONLY SCRIPT
已更新 Spartan
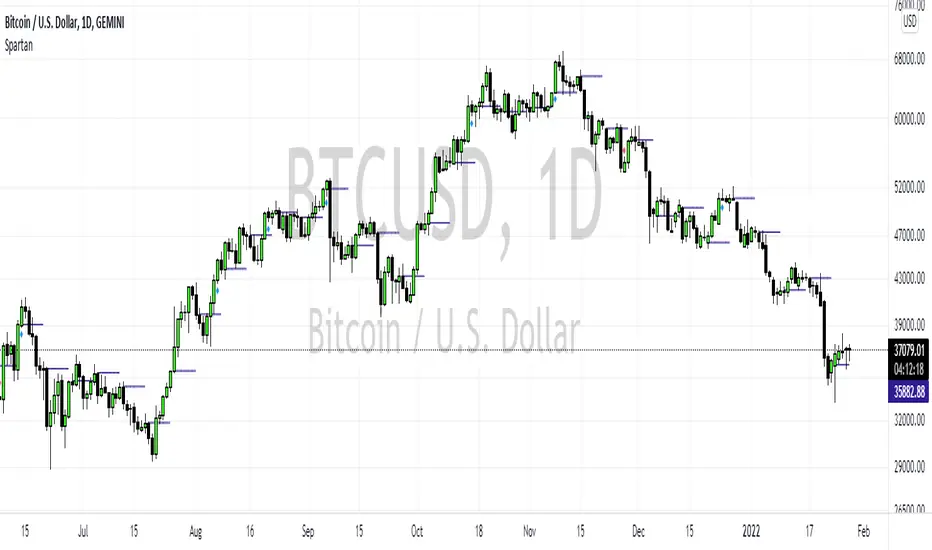
The Spartan Strategy.
This is a momentum strategy which attempts to identify when buying pressure or selling pressure is present in the markets.
How to trade the long side:
Once a blue candle appears, enter Long on pullbacks into a blue candle for longs
Place your stop loss on the opposite side of the blue candle.
Target a previous high for longs
How to trade the short side:
Once a red candle appears, enter Short on pullbacks into a red candle for shorts
Place your stop on the opposite side of the red candle.
Target a previous low for shorts
版本注释
Adds strong buy and sell zones to script. 版本注释
Removes red line from chart image. 版本注释
Adds the following features:Support and Resistance levels shown as:
- Previous Day Highs/Lows
- Previous Week Highs/Lows
- Previous Month Highs/Lows
版本注释
Removes daily / weekly / monthly levels as it makes chart too congested. 版本注释
Assigns grades to strong buying and strong selling pressure. A blue candle combined with a blue circle = High Strength Buying Pressure.
A blue candle combined with a orange circle = Medium Strength Buying Pressure.
A blue candle combined with a yellow circle = Low Strength Buying Pressure.
A red candle combined with a red circle = High Strength Selling Pressure.
A red candle combined with a orange circle = Medium Strength Selling Pressure.
A red candle combined with a yellow circle = Low Strength Selling Pressure.
版本注释
Removed colors仅限邀请脚本
只有作者授权的用户才能访问此脚本。您需要申请并获得使用许可。通常情况下,付款后即可获得许可。更多详情,请按照下方作者的说明操作,或直接联系LiquidityTracker。
TradingView不建议您付费购买或使用任何脚本,除非您完全信任其作者并了解其工作原理。您也可以在我们的社区脚本找到免费的开源替代方案。
作者的说明
contact me via trading view messages
免责声明
这些信息和出版物并非旨在提供,也不构成TradingView提供或认可的任何形式的财务、投资、交易或其他类型的建议或推荐。请阅读使用条款了解更多信息。
仅限邀请脚本
只有作者授权的用户才能访问此脚本。您需要申请并获得使用许可。通常情况下,付款后即可获得许可。更多详情,请按照下方作者的说明操作,或直接联系LiquidityTracker。
TradingView不建议您付费购买或使用任何脚本,除非您完全信任其作者并了解其工作原理。您也可以在我们的社区脚本找到免费的开源替代方案。
作者的说明
contact me via trading view messages
免责声明
这些信息和出版物并非旨在提供,也不构成TradingView提供或认可的任何形式的财务、投资、交易或其他类型的建议或推荐。请阅读使用条款了解更多信息。