INVITE-ONLY SCRIPT
MB Darvas Box

The algorithm is related to darvas theory.
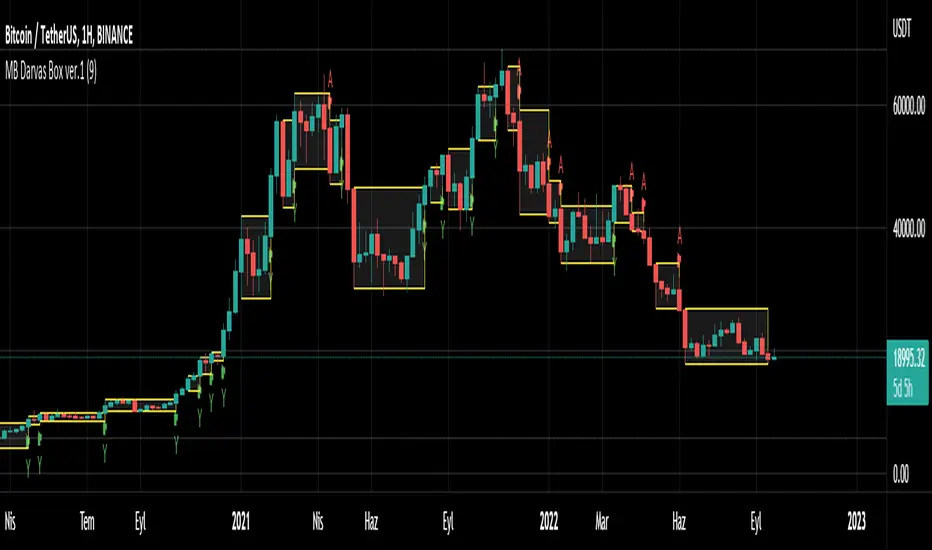
Creates resistance and support levels by creating boxes on the chart layout.
It creates flag icons in the form of Down (A) or Up (Y) according to these box breaks about the trend.
Considering the Darvas strategy, it also provides convenience in trailing stop.
-Alarm adding feature is available.
-Box color change can be edited from the settings section.
-Box fill color can be changed.
-Show/unhide history boxes is available in settings.
-Box calculation can be changed in time intervals.
-You must change the Box Limit entry to see fewer boxes.
It will be more meaningful if used together with the volume indicator.
It is not recommended for use in real transactions.
Does not include investment advice.
Algorithms are useful tools for making predictions.
仅限邀请脚本
仅限作者授权的用户访问此脚本,并且通常需要付费。您可以将其添加到收藏中,但是只有在向作者请求并获得许可之后,才能使用它。 请联系MaviiBeyazz了解更多信息,或按照以下作者的说明操作。
TradingView不建议付费使用脚本,除非您100%信任作者并了解脚本的工作原理。在许多情况下,您可以在我们的社区脚本免费找到不错的开源替代方案。
作者的说明
″Yazarla İletişime geçiniz.
contact the author
想在图表上使用此脚本?
警告:请在申请访问权限之前阅读。
免责声明
这些信息和出版物并不意味着也不构成TradingView提供或认可的金融、投资、交易或其它类型的建议或背书。请在使用条款阅读更多信息。