PROTECTED SOURCE SCRIPT
已更新 Price-Mapped Multi-Cycle Sine Waves
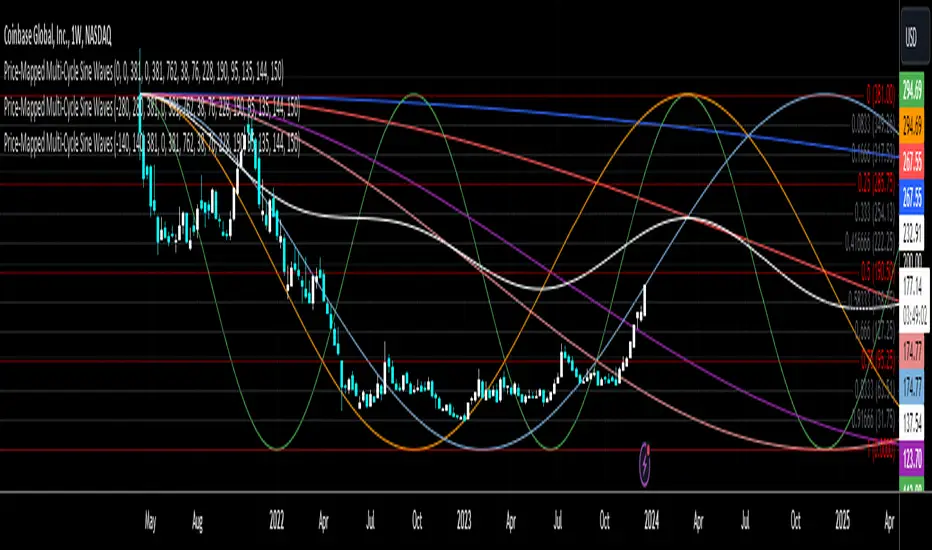
The primary function is to overlay a series of sine wave patterns onto a chart, providing a nuanced and visually intuitive representation of market dynamics.
Key features of this script include:
User-Defined Parameters: It allows users to input various parameters such as start bar (of the sine wave, so that we can start at a dynamic point), start date of the cycle plots, price range, and cycle lengths. These parameters enable customization of the sine wave patterns according to the user's specific analytical needs.
Multiple Sine Wave Cycles: It can generate up to ten different sine wave cycles, each with its own length and activation toggle.
Dynamic Visualization: The script plots these sine waves on the TradingView chart, each with a distinct color and the ability to offset the waves based on user input. This visual differentiation aids in easy identification and comparison of the different cycles.
Average Wave Calculation: Additionally, the script calculates an average wave based on the enabled cycles, providing a consolidated view of the market movement trends.
In essence, this script is a versatile tool for technical analysts and traders, offering a unique way to visualize and analyze market cycles and trends through the lens of sine wave theory. It stands as a testament to the confluence of mathematical elegance and practical financial analysis.
版本注释
An update to the image that was shared on this landing page受保护脚本
此脚本以闭源形式发布。 但是,您可以自由使用,没有任何限制 — 了解更多信息这里。
免责声明
这些信息和出版物并非旨在提供,也不构成TradingView提供或认可的任何形式的财务、投资、交易或其他类型的建议或推荐。请阅读使用条款了解更多信息。
受保护脚本
此脚本以闭源形式发布。 但是,您可以自由使用,没有任何限制 — 了解更多信息这里。
免责声明
这些信息和出版物并非旨在提供,也不构成TradingView提供或认可的任何形式的财务、投资、交易或其他类型的建议或推荐。请阅读使用条款了解更多信息。