INVITE-ONLY SCRIPT
已更新 Omega Smart Analyst
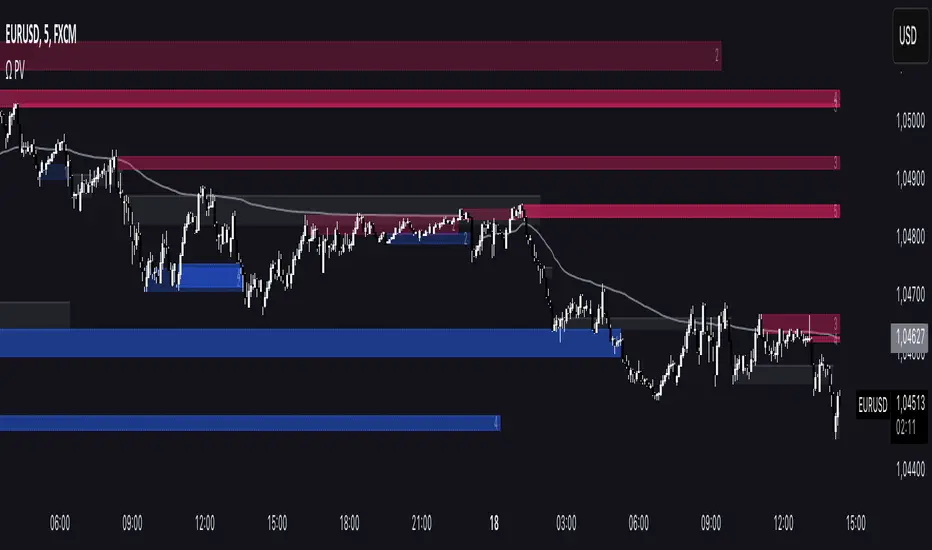
The Omega Smart analyst is a tool designed to help traders visualize in a clearer way key price levels on the chart based on the price and the volume.
The indicator has some features, including:
- Option to customize the colors for all of the tools available to have common aesthetics
- Option to choose the length and the sensitivity for all of the tools

Volume clusters: display automatic volume clusters that can be used as support or resistance following the order block theory. These levels can be highlighted or extended in the settings.

Support and resistance: show automatic support and resistance levels based on volume.
Candle coloring: color candles based on volume and volatility, great to use as a signal confirmation.


Full levels: show previous high, low, and close levels on the chart, great to use to detect liquidity and breakouts
Bias target: a tool to enhance one of the low or high of the previous full levels according to the daily liquidity bias ICT method. As shown in the picture above you can also choose to display only these levels.

Market structure: show the current trend according to the market structure.
Structure origin: shows the main level of support and resistance with an area that gives also an indication of the current price volatility.
Risk Disclaimer:
All content and scripts provided are purely for informational & educational purposes only and do not constitute financial advice or a solicitation to buy or sell any securities of any type. Past performance does not guarantee future results. Trading can lead to a loss of the invested capital in the financial markets. I will not accept liability for any loss or damage, including without limitation any loss of profit, which may arise directly or indirectly from the use of or reliance on such information. All investments involve risk, and the past performance of a security, industry, sector, market, financial product, trading strategy, backtest, or individual's trading does not guarantee future results or returns. Investors are fully responsible for any investment decisions they make. Such decisions should be based solely on an evaluation of their financial circumstances, investment objectives, risk tolerance, and liquidity needs.
The indicator has some features, including:
- Option to customize the colors for all of the tools available to have common aesthetics
- Option to choose the length and the sensitivity for all of the tools
Volume clusters: display automatic volume clusters that can be used as support or resistance following the order block theory. These levels can be highlighted or extended in the settings.
Support and resistance: show automatic support and resistance levels based on volume.
Candle coloring: color candles based on volume and volatility, great to use as a signal confirmation.
Full levels: show previous high, low, and close levels on the chart, great to use to detect liquidity and breakouts
Bias target: a tool to enhance one of the low or high of the previous full levels according to the daily liquidity bias ICT method. As shown in the picture above you can also choose to display only these levels.
Market structure: show the current trend according to the market structure.
Structure origin: shows the main level of support and resistance with an area that gives also an indication of the current price volatility.
Risk Disclaimer:
All content and scripts provided are purely for informational & educational purposes only and do not constitute financial advice or a solicitation to buy or sell any securities of any type. Past performance does not guarantee future results. Trading can lead to a loss of the invested capital in the financial markets. I will not accept liability for any loss or damage, including without limitation any loss of profit, which may arise directly or indirectly from the use of or reliance on such information. All investments involve risk, and the past performance of a security, industry, sector, market, financial product, trading strategy, backtest, or individual's trading does not guarantee future results or returns. Investors are fully responsible for any investment decisions they make. Such decisions should be based solely on an evaluation of their financial circumstances, investment objectives, risk tolerance, and liquidity needs.
版本注释
Now the Middle point of the Full levels options is the middle pivot point instead of the closing price版本注释
VWAP Added版本注释
Now the candle coloring is based on the lowest timeframe volume delta divergences版本注释
Semaphore Visual added: New data visualitation with more data on the chart版本注释
Semaphore Visual: separated the Forward value from the Lookback Value for more customisation.版本注释
Script Adjustments版本注释
Bug Fixes版本注释
Update: Added the Internal and External Swing Points, Added the Fair Value Gaps option.版本注释
Liquidation Bubbles Added in the Overlay Section版本注释
Minor Changes版本注释
Now users that doesn't have paid plans can use the indicator版本注释
Minor Adjustment版本注释
V2: This indicator has been extensively optimized to enhance performance, user interface efficiency, and overall aesthetic refinement, ensuring a superior user experience in financial analysis.仅限邀请脚本
只有作者授权的用户才能访问此脚本。您需要申请并获得使用许可。通常情况下,付款后即可获得许可。更多详情,请按照下方作者的说明操作,或直接联系OmegaTools。
TradingView不建议您付费购买或使用任何脚本,除非您完全信任其作者并了解其工作原理。您也可以在我们的社区脚本找到免费的开源替代方案。
作者的说明
In order to access the indicator please visit: http://www.omegatoolkit.com
免责声明
这些信息和出版物并非旨在提供,也不构成TradingView提供或认可的任何形式的财务、投资、交易或其他类型的建议或推荐。请阅读使用条款了解更多信息。
仅限邀请脚本
只有作者授权的用户才能访问此脚本。您需要申请并获得使用许可。通常情况下,付款后即可获得许可。更多详情,请按照下方作者的说明操作,或直接联系OmegaTools。
TradingView不建议您付费购买或使用任何脚本,除非您完全信任其作者并了解其工作原理。您也可以在我们的社区脚本找到免费的开源替代方案。
作者的说明
In order to access the indicator please visit: http://www.omegatoolkit.com
免责声明
这些信息和出版物并非旨在提供,也不构成TradingView提供或认可的任何形式的财务、投资、交易或其他类型的建议或推荐。请阅读使用条款了解更多信息。