INVITE-ONLY SCRIPT
已更新 Supertrend Rally Rollercoaster
Supertrend indicator is a trend following indicator similar to moving averages. You can use this on any timeframe if there is enough market data.
What about the Supertrend Rally Rollercoaster?
The main objective of this indicator is to avoid fake trends as much as possible and find the best bull and bear runs.
The best timeframe is the 15 minute timeframe.
This indicator consist of 4 Supertrend periods. The most important period of this indicator is the fourth period. This is the period that determines the overall trend for the timeframe.

The rest of the bands can be used as confirmations to the trend, determine trade entries, and possible as trade exits and scalping.
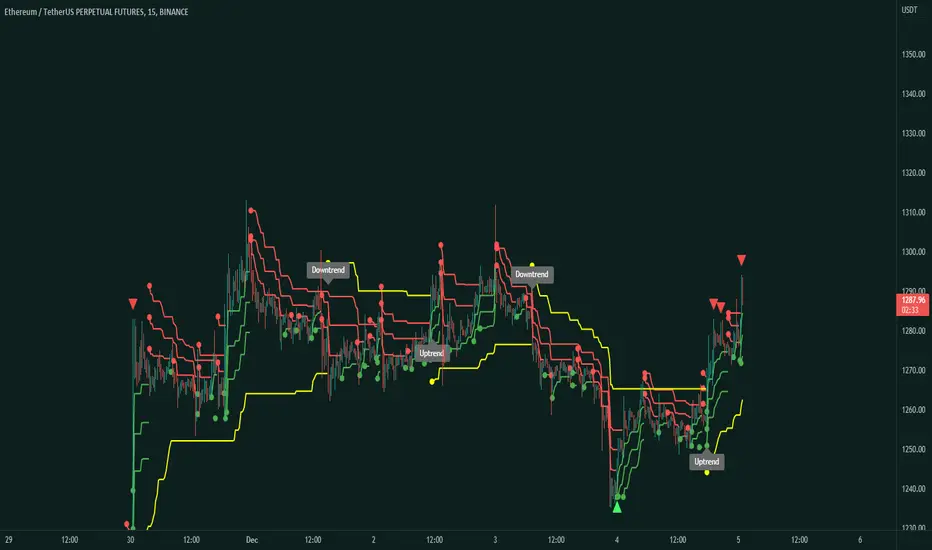
The main use of this indicator is to be used with value lines and contraction zones, as showed in the picture below.

So basically the average price or the mean is the value line produced by the contraction. The expansion follows, and then you must wait for the actual trend.
If price is below the value line then you wait for a uptrend and preferably a proper entry. Then you ride it up to the value line as TP, or you can
also let it continue on riding, but your preference.
If price is above value then, you wait for a downtrend and then short to value. This is the main trading strategy behind this indicator and what it has intended for.
The indicator also comes with alerts on when the trend changes and also on the arrows which are take profit symbols.
On an uptrend you will see red take profit signals which work with RSI. They tell you when a possible trend reversal can take place.

What about the Supertrend Rally Rollercoaster?
The main objective of this indicator is to avoid fake trends as much as possible and find the best bull and bear runs.
The best timeframe is the 15 minute timeframe.
This indicator consist of 4 Supertrend periods. The most important period of this indicator is the fourth period. This is the period that determines the overall trend for the timeframe.
The rest of the bands can be used as confirmations to the trend, determine trade entries, and possible as trade exits and scalping.
The main use of this indicator is to be used with value lines and contraction zones, as showed in the picture below.
So basically the average price or the mean is the value line produced by the contraction. The expansion follows, and then you must wait for the actual trend.
If price is below the value line then you wait for a uptrend and preferably a proper entry. Then you ride it up to the value line as TP, or you can
also let it continue on riding, but your preference.
If price is above value then, you wait for a downtrend and then short to value. This is the main trading strategy behind this indicator and what it has intended for.
The indicator also comes with alerts on when the trend changes and also on the arrows which are take profit symbols.
On an uptrend you will see red take profit signals which work with RSI. They tell you when a possible trend reversal can take place.
版本注释
Description Update仅限邀请脚本
只有作者授权的用户才能访问此脚本。您需要申请并获得使用许可。通常情况下,付款后即可获得许可。更多详情,请按照下方作者的说明操作,或直接联系Traders_Endeavors。
TradingView不建议您付费购买或使用任何脚本,除非您完全信任其作者并了解其工作原理。您也可以在我们的社区脚本找到免费的开源替代方案。
作者的说明
Get instant access here: https://www.patreon.com/user?u=80987417
Link Tree: linktr.ee/tradersendeavors
Access our indicators: patreon.com/user?u=80987417
Access our indicators: patreon.com/user?u=80987417
免责声明
这些信息和出版物并非旨在提供,也不构成TradingView提供或认可的任何形式的财务、投资、交易或其他类型的建议或推荐。请阅读使用条款了解更多信息。
仅限邀请脚本
只有作者授权的用户才能访问此脚本。您需要申请并获得使用许可。通常情况下,付款后即可获得许可。更多详情,请按照下方作者的说明操作,或直接联系Traders_Endeavors。
TradingView不建议您付费购买或使用任何脚本,除非您完全信任其作者并了解其工作原理。您也可以在我们的社区脚本找到免费的开源替代方案。
作者的说明
Get instant access here: https://www.patreon.com/user?u=80987417
Link Tree: linktr.ee/tradersendeavors
Access our indicators: patreon.com/user?u=80987417
Access our indicators: patreon.com/user?u=80987417
免责声明
这些信息和出版物并非旨在提供,也不构成TradingView提供或认可的任何形式的财务、投资、交易或其他类型的建议或推荐。请阅读使用条款了解更多信息。