OPEN-SOURCE SCRIPT
Bollinger Bands Squeeze
📈 Bollinger Bands Squeeze
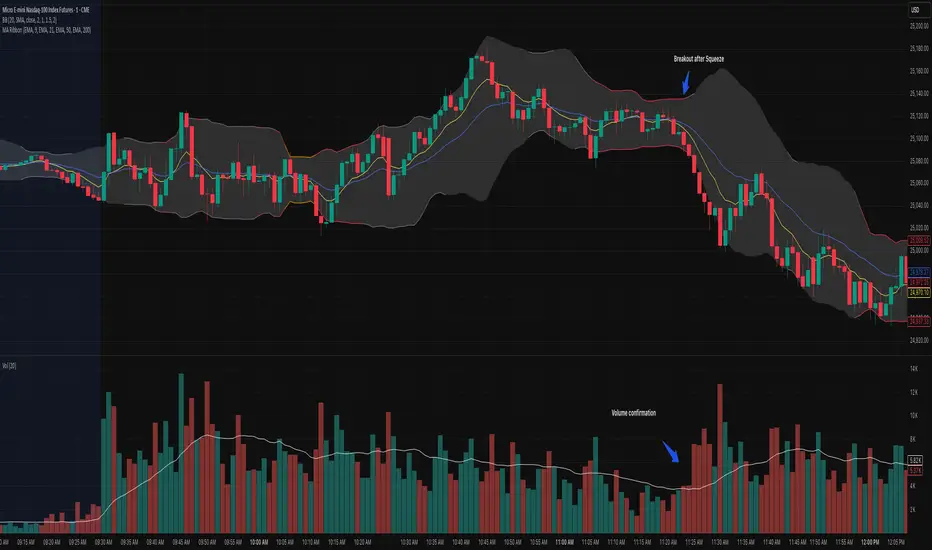
This indicator enhances traditional Bollinger Bands by integrating Keltner Channel layers to visualize market compression and volatility expansion — allowing traders to easily identify when a squeeze is building or releasing.
🔍 Overview
This is a refined version of the classic Bollinger Bands, designed to detect volatility squeezes using multiple Keltner Channel thresholds.
The script plots standard Bollinger Bands and dynamically colors the bands according to the degree of compression relative to the Keltner Channels.
⚙️ How It Works
Bollinger Bands are calculated from a selected moving average (SMA, EMA, SMMA, WMA, or VWMA) and standard deviation multiplier.
Keltner Channels are derived from ATR (True Range) using three sensitivity levels (1.0, 1.5, and 2.0× multipliers).
When Bollinger Bands contract inside a Keltner Channel, the script marks a squeeze state:
🟠 High Compression (Orange): Very tight volatility — expect breakout soon.
🔴 Mid Compression (Red): Moderate contraction — volatility is building.
⚫ Low Compression (Gray/Black): Early compression phase.
🧩 Inputs & Customization
Length: Period for both Bollinger and Keltner calculations.
Basis MA Type: Choose from SMA, EMA, SMMA (RMA), WMA, or VWMA.
StdDev Multiplier: Controls Bollinger Bandwidth.
Keltner Multipliers (1.0 / 1.5 / 2.0): Adjust compression thresholds.
Offset: Shifts the bands visually on the chart.
🕹️ Best Use Cases
Identify pre-breakout conditions before volatility expansion.
Combine with volume, momentum, or trend indicators (e.g., RSI) for confirmation.
Ideal for scalping, breakout trading, or volatility-based entries during session opens.
开源脚本
秉承TradingView的精神,该脚本的作者将其开源,以便交易者可以查看和验证其功能。向作者致敬!您可以免费使用该脚本,但请记住,重新发布代码须遵守我们的网站规则。
免责声明
这些信息和出版物并非旨在提供,也不构成TradingView提供或认可的任何形式的财务、投资、交易或其他类型的建议或推荐。请阅读使用条款了解更多信息。
开源脚本
秉承TradingView的精神,该脚本的作者将其开源,以便交易者可以查看和验证其功能。向作者致敬!您可以免费使用该脚本,但请记住,重新发布代码须遵守我们的网站规则。
免责声明
这些信息和出版物并非旨在提供,也不构成TradingView提供或认可的任何形式的财务、投资、交易或其他类型的建议或推荐。请阅读使用条款了解更多信息。