OPEN-SOURCE SCRIPT
Silen's EMA Areas
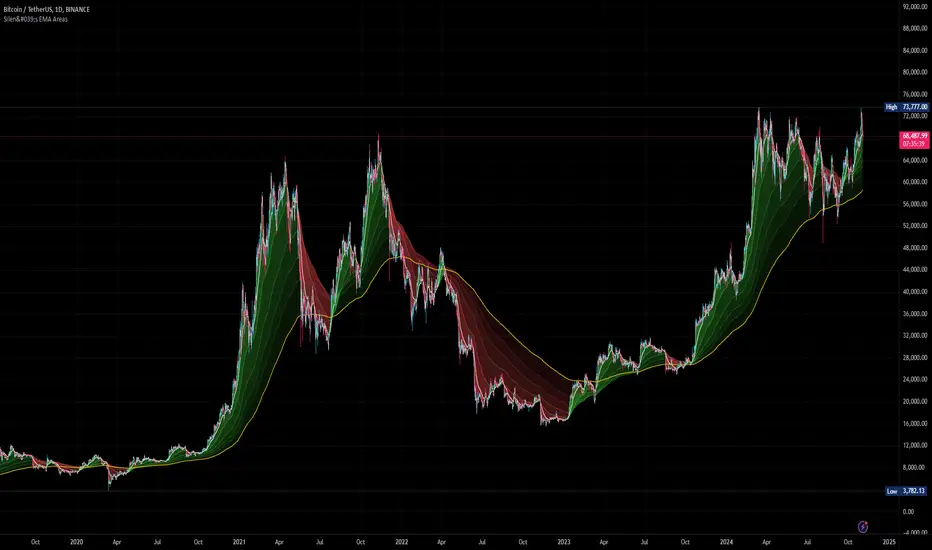
Are you tired of reading candles? 🧨 Do you want to bring more meaning to your chart? 🧹
Then this is the script for you!
This script does:
- Add several meaningfully pre-configured EMA lines to your chart - up to EMA 300
- Colors the areas between EMA lines in 3d colors - green and red
- The Smaller the EMA, the firmer the color
- Highlights the EMA 300 in a golden color
What is the meaning of this?
Let me introduce a new word to you: EMA FOLDING.
Yes, you heard right. With this indicator you can see in 3D how EMA lines are folding above and below each other, indicating severe mood swings in the chart.
This helps you keep track of what your instrument is actually doing while it enables you to cancel out the noise and messyness of ordinary candles which can be quite random and hard to read.
Once an EMA is fully positive or negatively folded (all ema lines are green and above each other from largest EMA to smallest EMA and vice versa for negatively folded) you can be sure that you are in a Trend or certain mood (for higher timeframes, from 15mins on).
I don't ever want to read any chart without having this indicator on. Whenever I present charts to anybody I use this indicator - and the feedback is insanely positive. People tend to read and understand charts much better with this indicator than just staring at candles.
Why is this indicator different to other EMA indicators and should thereby not be deleted by the TradingView Team due to redundance with other EMA indicators?
- This is not a simple indicator for EMAs
- Rather, this is an indicator to better and easier read the whole chart
- You can detect mood swings very easily which is very hard to do with a normal EMA indicator
- I haven't found any EMA indicator on TradingView that does this job so i sincerely believe it is extremely unique
- I sincerely believe it can help people get a much better understanding of charts without actualy getting into details of EMA's or even needing to know what an EMA is.
This indicator isn't intended for trading purposes, rather it is intended to give you a better and easier understanding of the chart. Of course - you can also use it for your trading but like I said, that is not the primary intended purpose.
This indicator comes pre-configured with quite optimal values (in my opinion) but of course can be fully customized. 🧮
Test it for yourself!
开源脚本
秉承TradingView的精神,该脚本的作者将其开源,以便交易者可以查看和验证其功能。向作者致敬!您可以免费使用该脚本,但请记住,重新发布代码须遵守我们的网站规则。
免责声明
这些信息和出版物并非旨在提供,也不构成TradingView提供或认可的任何形式的财务、投资、交易或其他类型的建议或推荐。请阅读使用条款了解更多信息。
免责声明
这些信息和出版物并非旨在提供,也不构成TradingView提供或认可的任何形式的财务、投资、交易或其他类型的建议或推荐。请阅读使用条款了解更多信息。