PINE LIBRARY
已更新 TPCLines_Public

Library "TPCLines_Public"
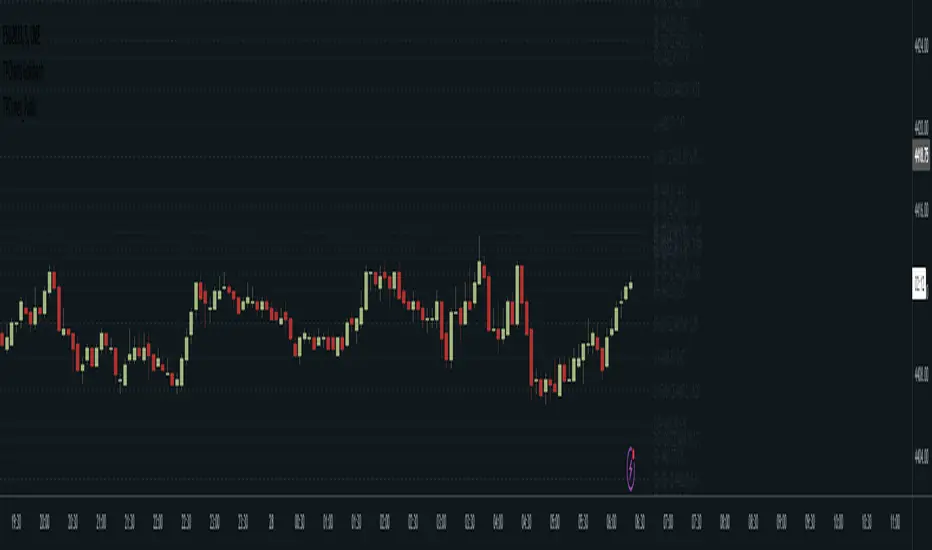
Helpers for lines
lineVA(start, lines, labels, lineColor, labelBgColor, labelTextColor, highPrice, lowPrice, extend, style, width, labelText, labelSize, labelStyle, labelTextAlign, bi) Draws a vertical line and optional label on the chart.
Parameters:
start: The start bar index or time.
lines: Line array to which the created line will be pushed.
labels: Label array to which the created label will be pushed.
lineColor: The color for the line and label.
labelBgColor: The background color for the label.
labelTextColor: The text color for the label.
highPrice: The upper price for the line.
lowPrice: The lower price for the line.
extend: Options for toggline line extend (extend.right, extend.left, extend.both, or extend.none). If none is provided, provides a best guess.
style: The line's style. Defaults to line.style_dotted.
width: The line's width. Defaults to 1.
labelText: Optional text to display next to the line.
labelSize: The label's size. Defaults to size.tiny.
labelStyle: The label's style. Defaults to label.style_label_left.
labelTextAlign: The label's text alignment. Defaults to text.align_center.
bi: Set true to use bar indices, set false to use time. Defaults to true (use bar indices).
Returns: Nothing. Draws a line and optional label on the chart.
lineHA(price, lines, labels, lineColor, labelBgColor, extend, labelTextColor, labelText, end, start, bi, showPrice, pips, style, width, labelAlign, labelSize, labelStyle, labelTextAlign) Draws a horizontal line and optional label on the chart.
Parameters:
price: The price at which to draw the lie.
lines: Line array to which the created line will be pushed.
labels: Label array to which the created label will be pushed.
lineColor: The color for the line and label.
labelBgColor: The background color for the label.
extend: Options for toggline line extend (extend.right, extend.left, extend.both, or extend.none). Defaults to extend.none.
labelTextColor: The text color for the label.
labelText: Optional text to display next to the line.
end: The time or bar index to end the line at.
start: The time or bar index to start the line at.
bi: Set true to use bar indices, set false to use time. Defaults to true (use bar indices).
showPrice: Option to show the price on the label.
pips: If a value is provided, will be displayed on the label.
style: The line's style. Defaults to line.style_solid.
width: The line's width. Defaults to 1.
labelAlign: Which side of the line to align the label on. Can be r for right, l for left, c for center, or t for the current time.
labelSize: The label's size. Defaults to size.tiny.
labelStyle: The label's style. Defaults to label.style_none.
labelTextAlign: The label's text alignment. Defaults to text.align_center.
Returns: Nothing. Draws a line and optional label on the chart.
lineH()
lineV()
版本注释
v2版本注释
Added an option to use a different text color for horizontal lines.Pine脚本库
秉承TradingView的精神,作者已将此Pine代码作为开源库发布,以便我们社区的其他Pine程序员可以重用它。向作者致敬!您可以私下或在其他开源出版物中使用此库,但在出版物中重用此代码须遵守网站规则。
免责声明
这些信息和出版物并非旨在提供,也不构成TradingView提供或认可的任何形式的财务、投资、交易或其他类型的建议或推荐。请阅读使用条款了解更多信息。
Pine脚本库
秉承TradingView的精神,作者已将此Pine代码作为开源库发布,以便我们社区的其他Pine程序员可以重用它。向作者致敬!您可以私下或在其他开源出版物中使用此库,但在出版物中重用此代码须遵守网站规则。
免责声明
这些信息和出版物并非旨在提供,也不构成TradingView提供或认可的任何形式的财务、投资、交易或其他类型的建议或推荐。请阅读使用条款了解更多信息。