OPEN-SOURCE SCRIPT
Prometheus Fractal-Based Trend
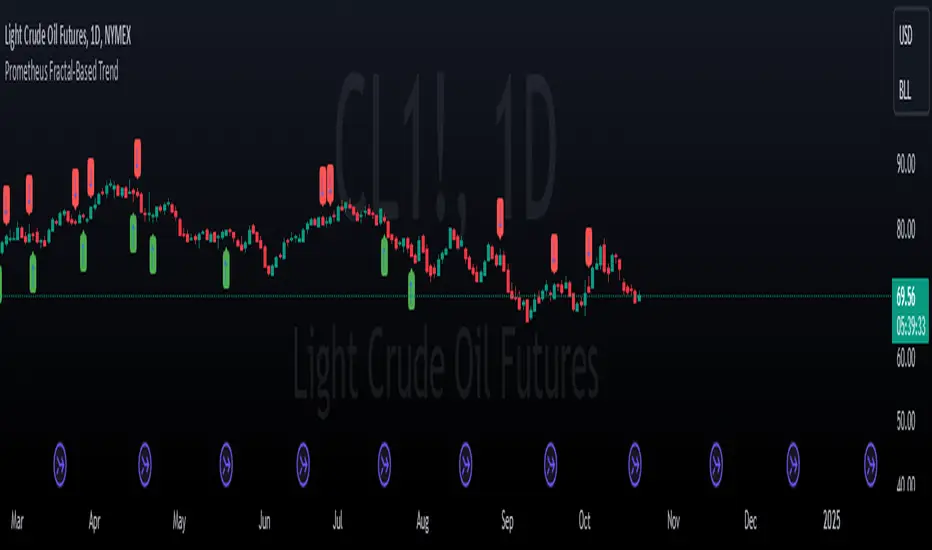
The Fractal-Based Trend indicator is a tool that uses fractals to try and detect which direction an underlying will continue to go.
Calculation:
A bullish fractal occurs when the current bar's high is lower than the previous bar high, and the previous bar's high is higher than both the high from two bars ago and the high from three bars ago.
A bearish fractal happens when the current bar's low is higher than the previous bar's low, and the previous bar's low is lower than both the low from two bars ago and the low from three bars ago.
When a bullish or bearish fractal forms, the corresponding value stored is the previous bar high for a bearish fractal or the previous bar's low for a bullish fractal.
The trade scenarios are when these fractals occur, a green or red label being plotted on the chart for whatever direction it predicts.
Trade examples:

We see on this daily chart of SPY that the fractals represent the potential for a directional trade that can last a few days. The more volatile a chart is the more of these fractals we can see.

We see on this 5 minute chart for TSLA there is way more activity, there are more sporadic candles on a lower time frame, so we can see more anomalies in the price action.

We see this to be true for BTCUSD even on a daily time frame, since it is very volatile. There are a lot of these labels plotted.
This is the perspective we aim to provide. We encourage traders to not follow indicators blindly. No indicator is 100% accurate. This one can give you a different perspective of price strength with volatility. We encourage any comments about desired updates or criticism!
Calculation:
A bullish fractal occurs when the current bar's high is lower than the previous bar high, and the previous bar's high is higher than both the high from two bars ago and the high from three bars ago.
A bearish fractal happens when the current bar's low is higher than the previous bar's low, and the previous bar's low is lower than both the low from two bars ago and the low from three bars ago.
When a bullish or bearish fractal forms, the corresponding value stored is the previous bar high for a bearish fractal or the previous bar's low for a bullish fractal.
The trade scenarios are when these fractals occur, a green or red label being plotted on the chart for whatever direction it predicts.
Trade examples:
We see on this daily chart of
We see on this 5 minute chart for
We see this to be true for
This is the perspective we aim to provide. We encourage traders to not follow indicators blindly. No indicator is 100% accurate. This one can give you a different perspective of price strength with volatility. We encourage any comments about desired updates or criticism!
开源脚本
秉承TradingView的精神,该脚本的作者将其开源,以便交易者可以查看和验证其功能。向作者致敬!您可以免费使用该脚本,但请记住,重新发布代码须遵守我们的网站规则。
免责声明
这些信息和出版物并非旨在提供,也不构成TradingView提供或认可的任何形式的财务、投资、交易或其他类型的建议或推荐。请阅读使用条款了解更多信息。
开源脚本
秉承TradingView的精神,该脚本的作者将其开源,以便交易者可以查看和验证其功能。向作者致敬!您可以免费使用该脚本,但请记住,重新发布代码须遵守我们的网站规则。
免责声明
这些信息和出版物并非旨在提供,也不构成TradingView提供或认可的任何形式的财务、投资、交易或其他类型的建议或推荐。请阅读使用条款了解更多信息。