OPEN-SOURCE SCRIPT
已更新 Price Stats / Price Data [LevelUp]
Introduction
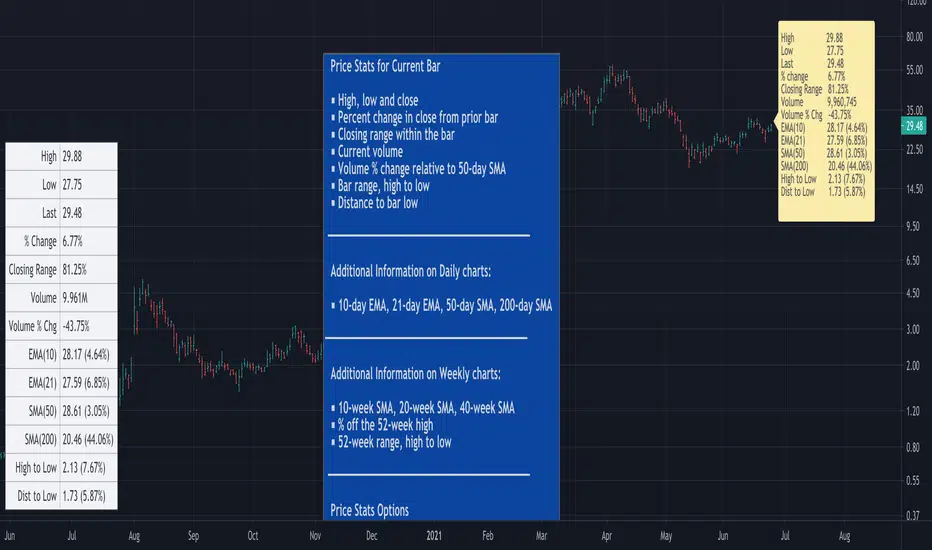
Price Stats is an indicator based on the statistics shown in MarketSmith charting software when viewing the Track Price information, also known as the "yellow box."
The following stats are available for the most recent price bar:
■ High price
■ Low price
■ Last price
■ Percent change in price from prior bar
■ Closing range within the bar
■ Current volume
■ Volume % change relative to the 50-day moving average volume
For daily charts:
■ 21-day EMA and % offset of price
■ 50-day SMA and % offset of price
■ 200-day SMA and % offset of price
Here's how to interpret the moving averages:
In the image below the 50-day SMA is 74.58 (8.04%). 74.58 represents the value of the 50-day SMA. 8.04% indicates that the current price is 8.04% above the SMA. A negative % would indicate the current price is the specified % below the SMA.
版本注释
version 2.0Add support to show price stats for weekly charts:
■ 10-week SMA and % offset of price
■ 40-week SMA and % offset of price
■ Price % off the 52-week high
■ 52-week price range, high to low
版本注释
version 3.0Updates:
■ Left/right offset of the Price Stats dialog can now be configured.
■ Minor changes to how the offset is calculated based on the day of the week.
版本注释
version 4.0Update:
■ Choose your preferred font size for the text.
版本注释
version 5.0Update:
■ Update formatting of the volume to make it easier to read.
版本注释
version 6.0Update:
■ Add "Distance to Low" option
Knowing the distance to the low can help when setting a stop. For example, if buying an upside reversal, a logical stop could be set at the low of the bar. At a glance, you can now see the percentage and distance in points from the current price to the low. This allows for a quick determination if low is within your preferred stop range.
版本注释
version 7.0Update:
■ Duplicate labels no longer appear when using the Bar Replay option
■ Code cleanup
版本注释
version 8.0Updates:
■ Vertical and horizontal placement of the Price Stats are now configurable.
■ Add 'High to Low' which shows range in price as points and percentage.
The 'High to Low' value may be helpful if you plan to buy on a breakout to a new high. At a glance, you'll know the percentage and distance in points if you opt to use the low of the bar as a stop.
版本注释
version 9.0What's new:
■ Add 20-week simple moving average to the weekly chart.
版本注释
version 10.0What's New:
■ Price Stats can be shown in a table with a configurable location.
版本注释
version 11.0What's New:
■ Computations that return NaN (Not a Number) will now return 0.
版本注释
version 12.0What's New:
■ Minor updates to the display of 52-week highs and lows.
开源脚本
本着TradingView的真正精神,此脚本的创建者将其开源,以便交易者可以查看和验证其功能。向作者致敬!虽然您可以免费使用它,但请记住,重新发布代码必须遵守我们的网站规则。
Access our premium tools: LevelUpTools.net
Join traders in over 40 countries and LevelUp!
Join traders in over 40 countries and LevelUp!
免责声明
这些信息和出版物并不意味着也不构成TradingView提供或认可的金融、投资、交易或其它类型的建议或背书。请在使用条款阅读更多信息。