INVITE-ONLY SCRIPT
MomentumPRO // PoC Candles + Footprint v1
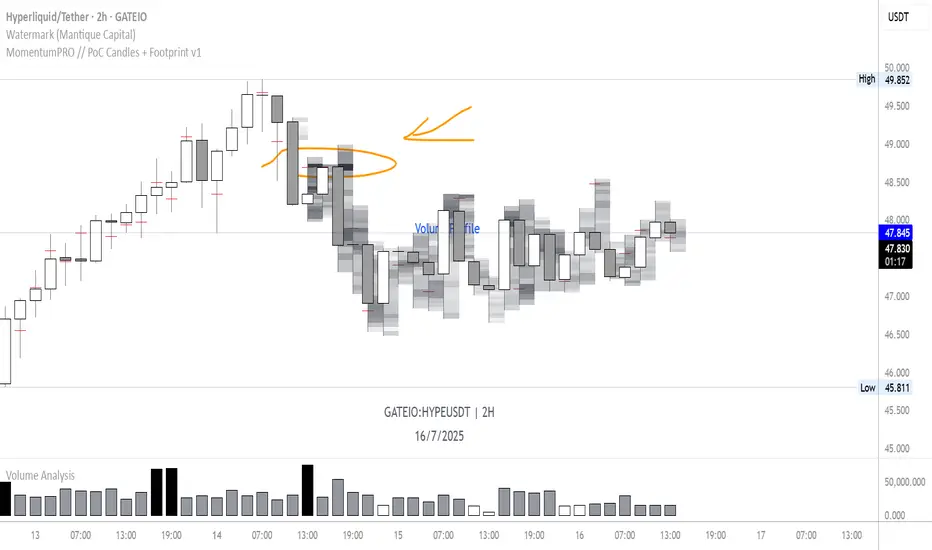
MomentumPRO // PoC Candles + Footprint - Advanced Volume Analysis
A sophisticated Point of Control (POC) and Footprint indicator that reveals the hidden volume distribution within each candle. This powerful tool transforms regular price bars into detailed volume profiles, showing exactly where institutional and retail traders are most active at each price level.
Key Features:
🔸 Point of Control (POC) - Identifies the exact price level with highest volume activity within each candle
🔸 Footprint Visualization - Displays volume distribution as color-coded boxes within each candle
🔸 Auto Timeframe Selection - Automatically chooses optimal lower timeframe for data collection
🔸 Dynamic Volume Bins - Intelligent bin calculation based on timeframe ratios for optimal resolution
🔸 Real-time Analysis - Updates POC and footprint data as price action develops
Customization Options:
🔸 Color Schemes - Choose from Blue, Red, Green, Purple, or Black themes
🔸 Contrast Control - Adjust visual contrast for better volume identification
🔸 Footprint History - Display up to 100 historical candles with footprint data
🔸 Bin Resolution - Customize minimum and maximum bins per candle for performance optimization
Best Used For:
+ Identifying high-volume price levels and potential support/resistance
+ Understanding intrabar volume distribution and market participation
+ Spotting volume imbalances and potential reversal zones
+ Analyzing institutional vs retail trading activity at specific price levels
+ Confirming breakouts and breakdowns with volume validation
Technical Advantages:
Uses lower timeframe data for precise volume mapping
Memory-optimized for smooth performance across all timeframes
Real-time POC updates for live trading decisions
Perfect for volume traders, day traders, and institutional analysts who need granular insight into market microstructure and volume-based decision making.
📞 Contact: t.me/Iuliiya_B for access
免责声明
这些信息和出版物并不意味着也不构成TradingView提供或认可的金融、投资、交易或其它类型的建议或背书。请在使用条款阅读更多信息。