PROTECTED SOURCE SCRIPT
已更新 [Algoros] BTC Major Trendline
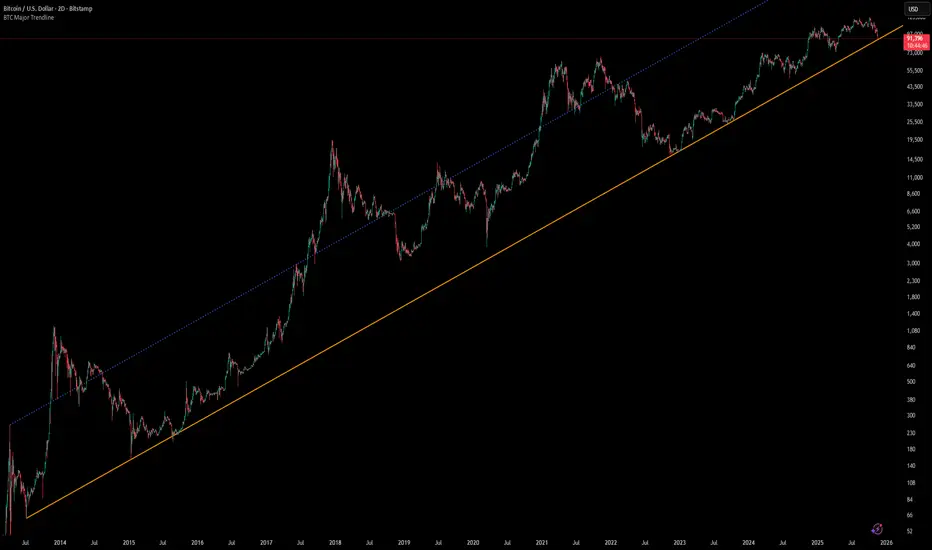
# BTC Major Trendline - Long-Term Bitcoin Trend Analysis
## Overview
BTC Major Trendline is a comprehensive technical analysis tool designed to track Bitcoin's long-term bullish trajectory using historically significant price points. This indicator establishes a primary upward trendline anchored to two major Bitcoin cycle lows, along with optional parallel channels and Fibonacci-based price projections.
## ⚠️ Important Requirements
**This indicator requires a Bitcoin chart with sufficient historical data dating back to at least April 2013.**
**✅ Recommended Charts:**
- `INDEX:BTCUSD` - Bitcoin Index (comprehensive history)
- `BITSTAMP:BTCUSD` - Bitstamp Bitcoin (default setting)
**❌ Will NOT work properly on:**
- Charts with limited history (Like hourly charts)
- Exchanges that launched after 2013
- Altcoin pairs or other cryptocurrencies
If the indicator doesn't display correctly, switch to one of the recommended Bitcoin charts above.
## Key Features
### 📈 Primary Trendline
- Anchored to two historically significant lows:
- **Start Point**: July 6, 2013 - Early Bitcoin accumulation phase
- **End Point**: November 21, 2022 - FTX collapse bottom
- Automatically calculates and extends the trendline based on these anchor points
- Displayed as a solid orange line
### 🔷 Parallel Channel Line (Optional)
- Creates an upper boundary by connecting historical high points:
- April 10, 2013 and June 11, 2017
- Helps identify potential resistance zones and channel breakouts
- Displayed as a blue dotted line for easy distinction
### 🎯 Fibonacci Trendline Multipliers (Optional)
- Seven Fibonacci-based projection lines: **1.6x, 2x, 3x, 5x, 8x, 13x, and 21x**
- Each multiplier creates a parallel trendline above the main trend
- Color-coded from teal to maroon for clear visual separation
- Useful for identifying potential profit-taking zones and long-term price targets
### 📉 Negative Fibonacci Trendlines (Optional)
- Seven division-based support lines: **÷1.6, ÷2, ÷3, ÷5, ÷8, ÷13, and ÷21**
- Projects downward channels below the main trendline
- Displayed in yellow tones for easy identification
- Helps identify extreme oversold conditions and potential bounce zones
## Customization Options
- **Symbol Input**: Track any Bitcoin pair with sufficient history (default: BITSTAMP:BTCUSD)
- **Show/Hide Components**: Toggle parallel line, Fibonacci multipliers, and negative Fibonacci lines independently
- **Line Extension**: Extend lines right, left, both directions, or none
- **Multi-Timeframe Compatible**: View on any timeframe once loaded on a compatible chart
## How to Use
1. **Setup**: First, open a Bitcoin chart with sufficient history (INDEX:BTCUSD or BITSTAMP:BTCUSD recommended)
2. **Trend Confirmation**: The main orange trendline represents the long-term bullish trajectory. Price staying above this line suggests the bull market remains intact.
3. **Channel Trading**: Use the parallel line (blue dotted) as a potential upper boundary for the long-term channel.
4. **Price Targets**: Enable Fibonacci multiplier lines to identify ambitious long-term price targets during bull runs. Higher multipliers (13x, 21x) represent parabolic extension zones.
5. **Support Identification**: Enable negative Fibonacci lines to spot potential support zones during corrections or bear markets.
6. **Risk Management**: Breaking below the main trendline could signal a shift in long-term trend, warranting caution.
## Technical Implementation
- Uses `request.security()` to fetch precise daily prices at historical timestamps
- Requires access to Bitcoin price data from April 2013 onwards
- Calculates slope dynamically based on anchor points
- All lines update in real-time as new price data emerges
- Efficient rendering system minimizes performance impact
## Best Used For
✅ Long-term Bitcoin investors and HODLers
✅ Identifying major trend direction
✅ Setting realistic long-term price targets
✅ Spotting potential support/resistance zones
✅ Multi-timeframe analysis (on compatible charts)
✅ Educational purposes (understanding logarithmic growth)
## Troubleshooting
**Lines not appearing?**
- Ensure you're viewing INDEX:BTCUSD or BITSTAMP:BTCUSD
- Check that the chart has data back to April 2013
- Verify the symbol input matches your chart
- Try switching to a daily or weekly timeframe first
版本注释
Update chart image版本注释
- Added a 'Symbol' setting for improved line drawing when using INDEX:BTCUSD. However, BITSTAMP:BTCUSD remains the recommended option.
版本注释
- Added error messages
受保护脚本
此脚本以闭源形式发布。 但是,您可以自由使用,没有任何限制 — 了解更多信息这里。
We build Bitcoin and crypto algorithms with the intention to outperform.
Check out our website to see more of our work.
Check out our website to see more of our work.
免责声明
这些信息和出版物并非旨在提供,也不构成TradingView提供或认可的任何形式的财务、投资、交易或其他类型的建议或推荐。请阅读使用条款了解更多信息。
受保护脚本
此脚本以闭源形式发布。 但是,您可以自由使用,没有任何限制 — 了解更多信息这里。
We build Bitcoin and crypto algorithms with the intention to outperform.
Check out our website to see more of our work.
Check out our website to see more of our work.
免责声明
这些信息和出版物并非旨在提供,也不构成TradingView提供或认可的任何形式的财务、投资、交易或其他类型的建议或推荐。请阅读使用条款了解更多信息。