OPEN-SOURCE SCRIPT
已更新 SMC Timing
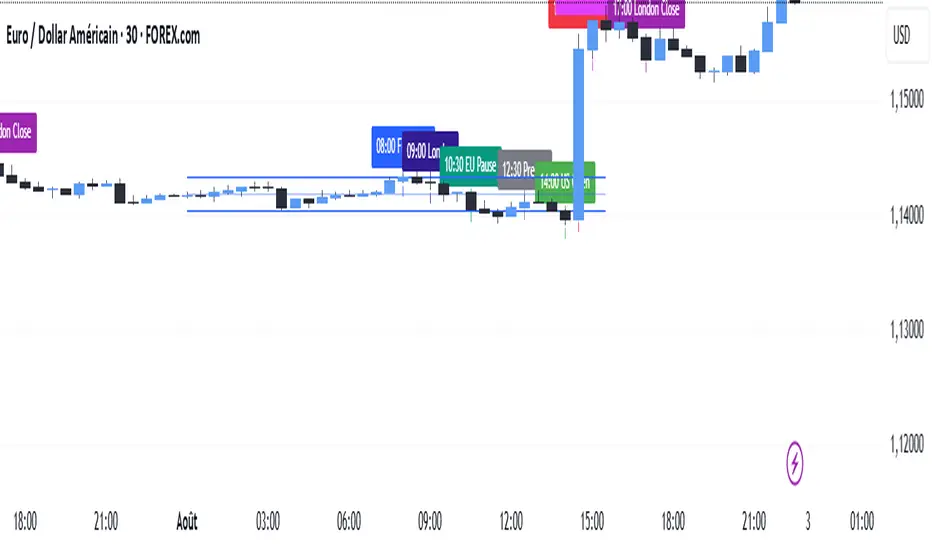
This indicator (“SMC Timing”) visually marks the exact moments when the market typically experiences large liquidity injections—moments that often trigger strong directional moves. By plotting dashed vertical lines and labels at key session boundaries and news events (Frankfurt open, London open, EU mid-session pause, Pre-US, US open, 14:30 U.S. news releases, 15:00 breakout window, and the London close), it draws your attention to the times when stop-runs and institutional orders tend to pile into the market.
Traders can use these timing zones to:
Anticipate liquidity sweeps where smart-money often liquidates weak positions or hunts stops.
Plan higher-probability entries just before or directly after these injections, reducing slippage and improving execution.
Improve win-rate consistency by aligning your trades with the natural ebb and flow of institutional flow rather than fading it.
With customizable session toggles, a “today-only” filter, and a small vertical offset to keep markers clear of price bars, this tool seamlessly integrates into any chart. Positioning yourself around these highlighted times helps you capture the bulk of intraday moves and avoids getting caught in low-liquidity chop.
版本注释
This indicator (“SMC Timing”) visually marks the exact moments when the market typically experiences large liquidity injections—moments that often trigger strong directional moves. By plotting dashed vertical lines and labels at key session boundaries and news events (Frankfurt open, London open, EU mid-session pause, Pre-US, US open, 14:30 U.S. news releases, 15:00 breakout window, and the London close), it draws your attention to the times when stop-runs and institutional orders tend to pile into the market.Traders can use these timing zones to:
Anticipate liquidity sweeps where smart-money often liquidates weak positions or hunts stops.
Plan higher-probability entries just before or directly after these injections, reducing slippage and improving execution.
Improve win-rate consistency by aligning your trades with the natural ebb and flow of institutional flow rather than fading it.
With customizable session toggles, a “today-only” filter, and a small vertical offset to keep markers clear of price bars, this tool seamlessly integrates into any chart. Positioning yourself around these highlighted times helps you capture the bulk of intraday moves and avoids getting caught in low-liquidity chop.
版本注释
V6版本注释
This indicator (“SMC Timing”) visually marks the exact moments when the market typically experiences large liquidity injections—moments that often trigger strong directional moves. By plotting dashed vertical lines and labels at key session boundaries and news events (Frankfurt open, London open, EU mid-session pause, Pre-US, US open, 14:30 U.S. news releases, 15:00 breakout window, and the London close), it draws your attention to the times when stop-runs and institutional orders tend to pile into the market.Traders can use these timing zones to:
Anticipate liquidity sweeps where smart-money often liquidates weak positions or hunts stops.
Plan higher-probability entries just before or directly after these injections, reducing slippage and improving execution.
Improve win-rate consistency by aligning your trades with the natural ebb and flow of institutional flow rather than fading it.
With customizable session toggles, a “today-only” filter, and a small vertical offset to keep markers clear of price bars, this tool seamlessly integrates into any chart. Positioning yourself around these highlighted times helps you capture the bulk of intraday moves and avoids getting caught in low-liquidity chop.
hier
Notes de version
This indicator (“SMC Timing”) visually marks the exact moments when the market typically experiences large liquidity injections—moments that often trigger strong directional moves. By plotting dashed vertical lines and labels at key session boundaries and news events (Frankfurt open, London open, EU mid-session pause, Pre-US, US open, 14:30 U.S. news releases, 15:00 breakout window, and the London close), it draws your attention to the times when stop-runs and institutional orders tend to pile into the market.
Traders can use these timing zones to:
Anticipate liquidity sweeps where smart-money often liquidates weak positions or hunts stops.
Plan higher-probability entries just before or directly after these injections, reducing slippage and improving execution.
Improve win-rate consistency by aligning your trades with the natural ebb and flow of institutional flow rather than fading it.
With customizable session toggles, a “today-only” filter, and a small vertical offset to keep markers clear of price bars, this tool seamlessly integrates into any chart. Positioning yourself around these highlighted times helps you capture the bulk of intraday moves and avoids getting caught in low-liquidity chop.
开源脚本
秉承TradingView的精神,该脚本的作者将其开源,以便交易者可以查看和验证其功能。向作者致敬!您可以免费使用该脚本,但请记住,重新发布代码须遵守我们的网站规则。
免责声明
这些信息和出版物并非旨在提供,也不构成TradingView提供或认可的任何形式的财务、投资、交易或其他类型的建议或推荐。请阅读使用条款了解更多信息。
免责声明
这些信息和出版物并非旨在提供,也不构成TradingView提供或认可的任何形式的财务、投资、交易或其他类型的建议或推荐。请阅读使用条款了解更多信息。